

EUR/NZD fixed at 1.9748 on the ECB reference for 20 October 2026, the lowest print since 1 September, and lower than it was on the day New Zealand's cash rate went up.
That is an odd place to announce a trend. Frankfurter's relay of ECB reference rates, retrieved at 07:31 UTC on 21 October 2026, still had 20 October as the latest date. The ECB's own daily file for that date carries the dollar at 1.1215, matching the feed. From 21 October 2025 to 20 October 2026 there are 255 reference dates. The high was 2.0603 on 25 November 2025 and the low was 1.9491 on 29 May 2026. The latest fix is 257 pips above that low and 855 under that high, 23.1% of the way up the range. Seventy-eight of the 255 rates were lower. The average was 1.9942 and the standard deviation 0.0265, so 1.9748 sits 0.73 of a standard deviation under the average, and 165 pips under the median of 1.9913.
| ECB reference | EUR/NZD | EUR/USD | NZD per USD | Why the date is here |
|---|---|---|---|---|
| 21 Oct 2025 | 2.0287 | 1.1607 | 0.57214 | First date in the sample |
| 25 Nov 2025 | 2.0603 | 1.1551 | 0.56065 | High of the sample |
| 29 May 2026 | 1.9491 | 1.1644 | 0.59740 | Low of the sample |
| 1 Sep 2026 | 1.9674 | 1.1590 | 0.58910 | Last fix below 1.9748 |
| 2 Sep 2026 | 1.9868 | 1.1578 | 0.58275 | OCR raised to 2.75% |
| 10 Sep 2026 | 1.9940 | 1.1616 | 0.58255 | ECB raises its key rates 25bp |
| 1 Oct 2026 | 2.0121 | 1.1298 | 0.56150 | Last fix at or above 2.01 |
| 8 Oct 2026 | 2.0014 | 1.1186 | 0.55891 | Weakest derived NZD per USD |
| 20 Oct 2026 | 1.9748 | 1.1215 | 0.56791 | Latest reference |
NZD per USD in that table is EUR/USD divided by EUR/NZD, rounded to five decimals. The ECB does not publish it as its own NZD dollar reference in this feed. The division is the check on which leg moved. A higher EUR/NZD is more New Zealand dollars per euro, which is a weaker kiwi against the euro.
Two currencies, not one story
Over the full year the cross fell 2.66%, from 2.0287 to 1.9748. The euro fell 3.38% against the dollar, from 1.1607 to 1.1215. The derived kiwi fell only 0.74% against the dollar, from 0.57214 to 0.56791. Take the dollar out and the year in EUR/NZD is mostly a euro story. The EUR/USD forecast on this site names 1.1250 as its bear case. The 20 October reference is 1.1215, 35 pips through that level, and 38 pips above the sample low of 1.1177 set on 7 October.
October does not repeat the year. From the 1 October fix of 2.0121 to the 20 October fix of 1.9748, EUR/NZD fell 1.85%, or 373 pips. Over those same two references the euro fell 0.73% against the dollar, from 1.1298 to 1.1215, and the derived kiwi rose 1.14%, from 0.56150 to 0.56791. Most of this month's damage to the cross is the New Zealand dollar, not a fresh collapse in the euro.
Split the month and the timing gets sharper. On 8 October the derived NZD per USD printed 0.55891, the low of the entire 255-day sample, while EUR/NZD was still 2.0014. Between 1 October and 8 October the cross eased only 0.53%, because the euro's 0.99% drop against the dollar was partly offset by a kiwi that was also weaker, by 0.46%. From 8 October to 20 October the cross fell 1.33%, the derived kiwi rose 1.61%, and the euro rose 0.26% against the dollar. The leg that actually pulled EUR/NZD down is the bounce off the kiwi's weakest dollar print of the year.
That bounce has not made the kiwi strong. The derived rate of 0.56791 is 1.61% above the 8 October low and 6.6% below the sample high of 0.60785 on 29 January 2026, the day EUR/NZD was 1.9689 and EUR/USD was 1.1968. The NZD/USD forecast on this site puts a bull case at 0.6150 and a bear case at 0.5550. The derived rate sits between those two cases, closer to a bounce off a low than to a breakout.
The hike day the cross rose
On 2 September 2026 the Reserve Bank of New Zealand raised the Official Cash Rate by 25 basis points to 2.75%. Paul Conway, Chief Economist, said on the Bank's OCR page that higher fuel prices had pushed inflation up to 4.1% in the June quarter, and that most indicators still pointed to a return to the 1% to 3% band next year. The page adds that the OCR may need to rise further this year so inflation can get back to 2%. The next update listed there is 2:00pm on 28 October.
The ECB reference on the day of that hike was 1.9868. The day before, it was 1.9674. The cross rose 0.99%. EUR/USD barely moved, from 1.1590 to 1.1578, a 0.10% dip. The derived kiwi fell from 0.58910 to 0.58275, a 1.08% drop. The kiwi weakened on the day the cash rate went up. The euro did not rally.
A week later the ECB moved. On 10 September the Governing Council raised its three key rates by 25 basis points. The deposit facility, the main refinancing rate and the marginal lending facility went to 2.50%, 2.65% and 2.90%, with effect from 16 September. The Council said it is not pre-committing to a rate path. The staff baseline published with that decision has headline inflation at 3.0% in 2026, 2.5% in 2027 and 2.1% in 2028, and growth at 0.9%, 1.4% and 1.5%.
The policy gap did not widen. Before the 2 September decision the OCR was 2.50%, 25 basis points above an ECB deposit rate that was still 2.25%. After the RBNZ move and before the ECB move, the gap was 50 basis points. Once the deposit facility went to 2.50%, the gap was 25 basis points again, and that is where it stands on 21 October: 2.75% against 2.50%. The September hike week was a catch-up by Frankfurt, not a new New Zealand premium.
The cross did not fall through any of it. It was 1.9940 on 10 September, 2.0021 on 16 September, the day the ECB rates took effect, and 2.0121 on 1 October. The entire decline this page is about, from 2.0121 to 1.9748, happened after both hikes were public and after the gap had settled back at 25 basis points. A 28 October OCR increase repeats a test the September announcement already failed.
4.1% and 3.8% are not a chasm
The comfortable comparison sets New Zealand's 4.1%, outside a 1% to 3% band, against a euro area "around 2%". The second half is stale. Eurostat's 16 October release put euro-area inflation at 3.8% in September 2026, up from 3.2% in August and 2.2% a year earlier. Energy was 18.9%, from 14.3% in August, and contributed 1.71 percentage points. Services were 3.2%. Excluding energy, food, alcohol and tobacco, the rate was 2.5%. The 2 October flash had already been 3.8%. The next flash is 4 November.
They are not the same statistic. New Zealand's 4.1% is the June quarter, the figure the RBNZ is still publishing next to the OCR. The euro area's 3.8% is a September rate. Subtracting one from the other and calling the result a live gap is a category error. Eurostat's run into that month was already warm: April 3.0%, May 3.2%, June 2.8%, July 2.9%, August 3.2%. The ECB's 3.0% for 2026 is a full-year staff average from 10 September, so a hot September does not by itself break it. It does mean later months have to cool. Both banks name the same fuel shock.
Carry does not rescue the gap. From 20 October 2026 to 31 March 2027 is 162 days. Using the deposit facility as the euro rate and the OCR as the kiwi rate, 1.9748 × (1 + 0.0275 × 162/365) / (1 + 0.0250 × 162/365) equals 1.97697, a forward of 1.9770, 22 pips above spot. The higher New Zealand rate makes the forward kiwi slightly weaker, so the forward cross is higher, not lower. Twenty-two pips is the whole policy gap if both rates sit still. October has already moved 373 pips. The May low is still 257 pips away. The gap is real, and it is too small to pick 1.89 over 2.06.
Seven dates, not one Thursday
The ECB calendar puts a monetary-policy meeting in Frankfurt on 28 and 29 October, with the press conference on 29 October. The RBNZ announces at 2:00pm on 28 October, the day before. The order is Wellington first, Frankfurt second, inside 24 hours. A forecast that ends on that Thursday is a note about one week. This one runs to 31 March 2027, and the calendars already name what sits inside that window.
After that week the ECB calendar lists decisions on 16-17 December 2026, 3-4 February 2027 and 17-18 March 2027. The 18 March press conference is the last one inside the horizon. The 28-29 April meeting is not. The RBNZ page lists a Monetary Policy Statement on 9 December and a review on 10 February, and it does not post a March date, so none is assumed. That is seven decision points: Wellington on the 28th, Frankfurt on the 29th, a December pair, a February pair, and the March ECB meeting. September already showed that matching 25 basis point hikes can land on a higher EUR/NZD. Late October changes the information only if the wording changes, or if the cross prints something the last 255 references have not.
Where 2.06 and 1.89 come from
The peaks have been getting lower. After the 25 November 2025 high of 2.0603, the local highs were 2.0339 on 9 January 2026, 2.0267 on 7 April, 2.0181 on 26 June and 2.0121 on 1 October. Four attempts, each one under the last. Only eight reference dates in the whole sample printed at or above 2.05, and every one of them fell between 7 November and 25 November 2025. A bull case that needs a new high is a different trade from a bull case that needs a return to a high the market has already printed once. This page uses the second.
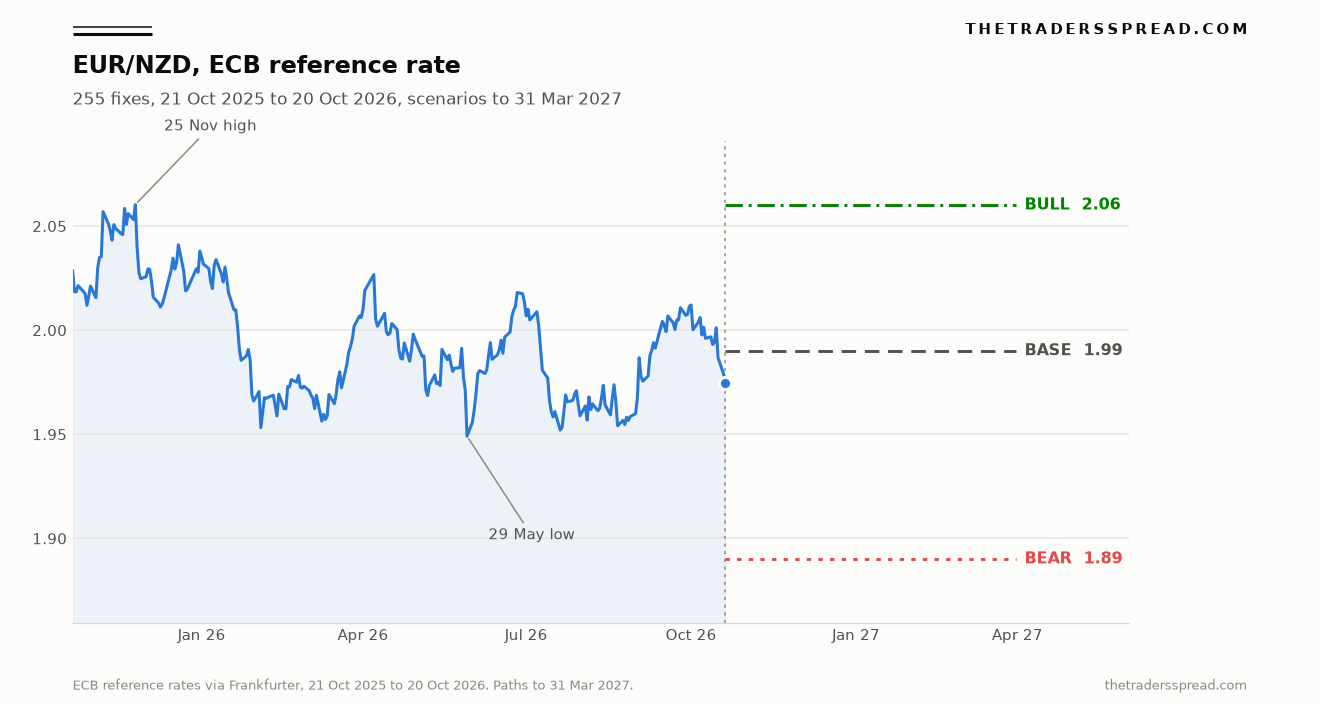
ECB reference rates via Frankfurter, retrieved 21 October 2026. The lines to the right of the last fix are scenarios to 31 March 2027, not a history. Bull is 2.06, base is 1.99, bear is 1.89.
The bull case is 2.06. That is three pips under the 25 November high of 2.0603, so it is a retest of the high rather than a break through it. From 1.9748 it is 852 pips, or 4.31%. It requires the sequence of lower peaks to break. January, April, June and October all failed in front of 2.06. The weight on this path is 30%, and the lower highs are why it is not higher.
The floor has not stepped down with the ceiling. Twenty-one fixes, 8.2% of the sample, printed at or below 1.96: early February, early March, 29 May and 1 June, the second half of July, and August, which still bottomed at 1.9541 on 21 August. Nothing in the file prints below 1.9491. The 20 October fix has not reached that shelf. It is 257 pips, 1.3%, above a low that four approaches failed to break.
RelatedUSD/SGD Forecast: 1.3200 Bull Case vs 1.2500 Bear Case
The bear case is 1.89, a break rather than a retest. From the 1 October high of 2.0121 down to the 29 May low of 1.9491 is 0.0630. Take that same distance off the low and the result is 1.8861, which rounds to 1.89. From 1.9748 that is 848 pips, or 4.29%, almost the same percentage as the bull case. Spot is closer to the low in pips, 257 against 855, which is why a breakdown feels near. Near is not through. The weight is 25% because the path needs a fix this sample has never printed.
The base case is 1.99, the median of 1.9913 rounded to the cent. It is 152 pips, or 0.77%, above the latest fix. October's slide joins April, June and early October as another trip into the lower half, and the fix drifts back to the middle of the distribution by 31 March. No new high is required, and the May low does not have to break. The weight is 45%, a judgement of this desk. No listed EUR/NZD contract sits behind it.
Three paths to 31 March 2027
| Path | Level | From 1.9748 | Weight | What has to be true |
|---|---|---|---|---|
| Bull | 2.06 | +852 pips, +4.31% | 30% | The lower-high sequence breaks and the November 2025 high is retested. The kiwi's bounce off 0.55891 fades. The May low holds. |
| Base | 1.99 | +152 pips, +0.77% | 45% | The fix returns to the median of the last 255 references. Neither 2.0603 nor 1.9491 gives way. |
| 20 Oct reference | 1.9748 | Latest ECB reference, retrieved 21 October 2026. | ||
| Bear | 1.89 | -848 pips, -4.29% | 25% | A fix through 1.9491 that does not bounce, with the derived kiwi moving toward the January high rather than stalling. |
The bull path needs the lower highs to break, and it needs the euro to hold above its 7 October low of 1.1177. A deposit rate that stays at 2.50% on 29 October, with the next Eurostat flash still near 3.8%, leaves the 25 basis point gap where September left it. A further ECB increase would close the gap. Breadth says whether the kiwi bounce is bigger than the euro. The GBP/NZD forecast is the sterling cross, and the AUD/NZD forecast puts the Reserve Bank of Australia on the other side instead of the ECB. If the kiwi is bid on both, the weight on 2.06 comes down.
The base path is the lean. From 1.9748 the direction is up, toward 1.99, so the bias is bullish even though 2.06 is not the central case. The invalidation is 1.9491, not 1.89. A reference under the 29 May low retires the shelf, and 1.89 becomes the path that fits. Until that print exists, a fix 0.73 of a standard deviation under the average is a dip in a sample. Conviction is 3 out of 5, because the next eight days can still break the low.
The bear path owns the falling ceiling, from 2.0603 to 2.0339, 2.0267, 2.0181 and 2.0121. A range with that shape can resolve lower. In 255 sessions it has not. Reaching 1.89 also asks the derived kiwi to travel toward 0.60785, 7.0% above 0.56791, a larger dollar move than the kiwi has managed since January. The NZD/CAD forecast is where that move would show up against a currency that is not the euro.
What would change the view
- An ECB reference below 1.9491. That is the invalidation. The shelf visited in February, May, July and August would have failed, and 1.89 would replace 1.99 as the path that fits the fix.
- A derived NZD per USD, built the same way, through the 29 January high of 0.60785. The bounce off 0.55891 would have become a trend, not a recovery from the year's weakest print.
- An OCR decision on 28 October that drops the Bank's line about inflation returning to the 1% to 3% band next year, paired with an ECB decision on 29 October that leaves the deposit facility at 2.50% while euro-area inflation is still printing near 3.8%. Either event on its own repeats September. The pair of them would add weight to 1.89.
- The 4 November euro-area flash, and a New Zealand inflation figure that replaces the June quarter's 4.1% as the number the RBNZ puts next to the OCR. If those two prints move together, the inflation contrast used to argue for a lower cross shrinks further. If New Zealand re-accelerates and the euro area cools back toward the staff average of 3.0%, the bear case gains the gap it does not have today.
- A fix above 2.0603. The bull case of 2.06 treats the November high as a ceiling to be retested, not a level to be cleared. Through it, that ceiling was wrong, and the lower-high sequence would have broken.
Questions the fix leaves open
Where does this EUR/NZD forecast put the rate by 31 March 2027?
The base path is 1.99, the median of 255 ECB references rounded to the cent, 0.77% above the 20 October fix of 1.9748. The bull case is 2.06, three pips under the 25 November 2025 high. The bear case is 1.89, the 1 October-to-29 May drop projected through that low and rounded. Weights of 45%, 30% and 25% are this desk's judgements, not prices from a contract. A reference under 1.9491 retires the base path.
Why is the bull case above the fix if the RBNZ may hike again?
Because the last hike did not produce a lower cross. On 2 September 2026 the cash rate went to 2.75% and EUR/NZD rose from 1.9674 to 1.9868, with the kiwi weaker against the dollar. After the ECB matched the move, the policy gap was 25 basis points again. The cross then reached 2.0121 on 1 October. A further OCR increase on 28 October repeats a test the fix has already sat through, and it finished that test higher.
What print would retire the 1.99 base path?
A reference below 1.9491, the 29 May 2026 low, which is the invalidation on the lean from 1.9748 toward 1.99. The shelf was visited in February, May, July and August without a lower fix, and 1.9748 is still 257 pips above it. Through 1.9491 the floor of this sample is gone and 1.89 is the downside that fits. A fix above 2.0603 would, separately, retire 2.06 as a retest of the old high.
This is analysis, not a recommendation to transact in the euro, the New Zealand dollar, or any contract for difference. The scenarios run to 31 March 2027 and use ECB reference rates retrieved on 21 October 2026. The weights are judgements. Money placed in these markets can be lost.