

The claim that the Norwegian krone "is" an oil price still gets repeated whenever Brent jumps. On the Frankfurter grid for 20 November 2026, EUR/NOK is a division of two dollar prices from that one date. One dollar bought 9.7525 kroner and 0.90992 euro. Dividing 9.7525 by 0.90992 produces 10.71798 kroner per euro. Frankfurter's own euro-base series prints 10.718 for the same day, which is that quotient once it is rounded to three decimals.
The three-month points that follow from the policy rates alone are a separate object from that spot. Norges Bank's policy rate is 4.5 percent after the decision published on 5 November 2026, and the European Central Bank deposit facility is 2.50 percent. The gap is 2.00 percentage points. On an Actual/360 count, 10.71798 multiplied by 0.020 and by 90/360 equals 0.05359 kroner, so the policy-rate forward sits at 10.77157. That figure is arithmetic from the two policy rates, not a bank's quoted forward.
"It will likely be necessary to keep the policy rate elevated for a time, and we are prepared to raise the policy rate if needed to bring inflation down to target within a reasonable time horizon," Governor Ida Wolden Bache said, after calling inflation too high, in the Norges Bank press release published on 5 November 2026. The committee had met on 4 November and kept the policy rate at 4.5 percent. The same release said the rate was raised to 4.5 percent at the September meeting, and that new forecasts arrive with the decision on 17 December 2026.
Data as of 22 November 2026, the day the Frankfurter pull, the two central-bank pages and the EIA Brent workbook were read. Seven steps rebuild EUR/NOK from those pages. An EUR/NOK forecast still has to start from this cross and this gap, and the steps stop once the arithmetic is on the page.
Key facts
- Norges Bank policy rate: 4.5 percent, held at the 4 November 2026 meeting and published on 5 November 2026. Source: Norges Bank press release.
- ECB deposit facility: 2.50 percent with effect from 16 September 2026, left unchanged on 29 October 2026, with main refinancing at 2.65 percent and marginal lending at 2.90 percent. Source: ECB key interest rates table and the 29 October decision.
- Gap used here: 4.5 minus 2.50, which is 2.00 percentage points, or 0.020 in the formula.
- Dollar legs on 20 November 2026: 0.90992 euro per dollar and 9.7525 kroner per dollar. Quotient: 10.71798 kroner per euro. Source: Frankfurter, base USD, retrieved 22 November 2026.
- Three-month policy-rate points, Actual/360: 0.05359 kroner per euro. Outright: 10.77157. Inputs are the two policy rates and the spot from the division.
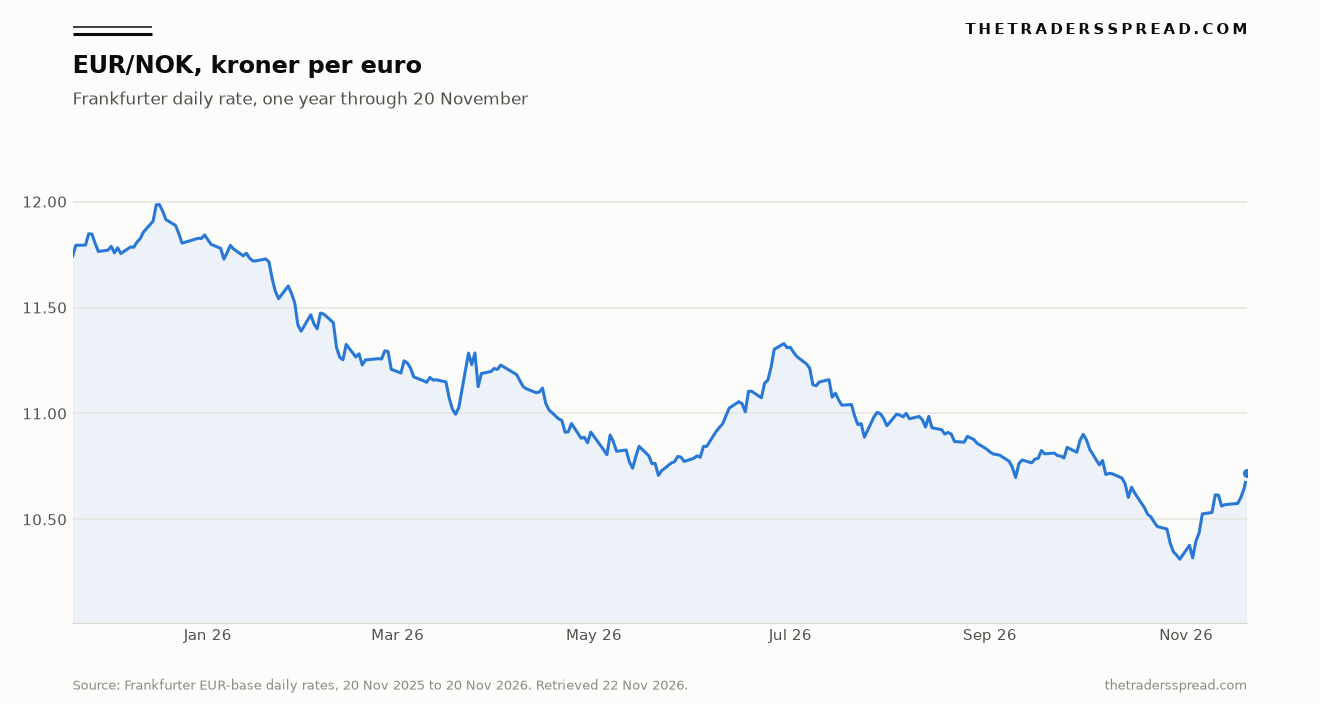
- Euro-base history: 11.7405 on 20 November 2025 to 10.718 on 20 November 2026, down 8.71 percent across 256 prints. Source: Frankfurter, base EUR.
- Brent: Pearson correlation of daily percent changes is minus 0.250 on 90 common sessions from 14 July 2026 to 17 November 2026. Europe Brent spot was 92.94 dollars a barrel on 17 November 2026. Source: EIA series RBRTE.
Step 1. Read the two policy rates from the banks
The krone leg is the Norges Bank policy rate. The euro leg is the ECB deposit facility, because that is the rate the Eurosystem uses to steer the stance. The key ECB interest rates table records the March 2024 decision to steer through the deposit facility. The row with effect from 16 September 2026 shows a deposit facility of 2.50, fixed-rate main refinancing at 2.65, and marginal lending at 2.90. The previous row, 17 June 2026, shows the deposit facility at 2.25.
The 29 October 2026 decision left all three rates on that September row. The press release states that the deposit facility, the main refinancing operations and the marginal lending facility "will remain unchanged at 2.50%, 2.65% and 2.90% respectively." Christine Lagarde, President of the ECB, told the press conference that day that the Council had debated a rise and then "unanimously decided that we were well positioned enough at this stage to hold, and that a measured approach, at this point in time, remained appropriate." September inflation in that statement was 3.8 percent, from 3.2 percent in August.
The 5 November Norges Bank release is the krone-side record. The committee kept 4.5 percent, put September CPI at 3.4 percent and CPI adjusted for tax changes and excluding energy at 3.0 percent, and said the krone had appreciated and was stronger than assumed. The next decision with new forecasts is 17 December 2026. The ECB meeting calendar puts the next monetary policy meeting on 16 and 17 December 2026, with the press conference on the second day, and Lagarde called December a projection exercise. Until those pages change, the gap uses 4.5 and 2.50.
Step 2. Subtract the deposit facility from the policy rate
EUR/NOK is quoted as kroner per euro, so the Norwegian rate is the quote-currency rate and the euro rate is the base-currency rate. The gap in the forward formula is the quote rate minus the base rate: 4.5 minus 2.50 equals 2.00 percentage points, or 0.020. The sign sets the direction of the points. A higher Norwegian policy rate, entered this way, places the three-month outright above spot, which is the krone at a forward discount against the euro inside this arithmetic.
Swapping in the main refinancing rate shows why the deposit facility is the rate that belongs here. Main refinancing is 2.65 percent on the same ECB table, so 4.5 minus 2.65 is 1.85 percentage points. Through the same spot and the same 90/360 fraction, that gap produces 0.04957 kroner of points rather than 0.05359. The 0.15 percentage point between 2.50 and 2.65 is the whole of that difference. Marginal lending, at 2.90 percent, is the top of the corridor and stays out of the steering gap.
Step 3. Pull both dollar legs for one date
Frankfurter's dollar-base response for 20 November 2026 carries two numbers and one date. With the base set to USD and the quotes limited to EUR and NOK, the payload is 0.90992 euro per dollar and 9.7525 kroner per dollar, dated 2026-11-20. Those are the two USD legs. Both are foreign currency per dollar, so they share a unit and can be divided. The request is the v1 URL for that day, base USD, symbols EUR and NOK, retrieved on 22 November 2026. The file skips weekends, which is why the latest print in the pull is Friday 20 November.
Both legs have to share a provider and a day, or the quotient blends two fixing conventions. GBP/SGD is the product of two dollar rates, with the hours of the fix included. EUR/NOK here is a division, because both downloaded legs are already expressed per dollar, and step 4 inverts one leg only as a check.
Step 4. Divide kroner per dollar by euro per dollar
Dividing 9.7525 by 0.90992 gives 10.717975, which rounds to 10.71798 kroner per euro at five decimals. That is the spot carried into the forward. Frankfurter's euro-base print for the same date is 10.718, so the published cross and the division agree at three decimals. The chart uses that euro-base series, and the worked example stays with the division.
The multiplication check inverts the euro leg. One divided by 0.90992 is 1.098998 dollars per euro, and 1.098998 multiplied by 9.7525 is 10.71798 again, the same cross in the chain-rule writing. The division leaves both legs in the form Frankfurter sent, and the chain is the writing that looks like euro-to-dollars times dollars-to-kroner. They match when the inverted leg and the kroner leg share a date.
NOK/SEK starts from two dollar rates on one day by the same kind of division, on a different pair, which is a useful habit when the question is which leg moved. On EUR/NOK the euro-base history runs from 11.7405 on 20 November 2025 to 10.718 on 20 November 2026 across 256 observations, 8.71 percent lower at the end. The high in the window is 11.9858 on 17 December 2025 and the low is 10.3120 on 30 October 2026, ten days before the November rate decision. The drawing is that euro-base history, and 10.77157 stays off it because the forward is arithmetic while the line is a record of prints.
Step 5. Multiply the spot by the gap and by 90/360
The day-count convention here is Actual/360, the money-market fraction that prices euro and krone deposits on a 360-day year. Ninety divided by 360 is 0.25, a quarter of that year, and it is the fraction the formula asks for. It stands for a standard three-month period, rather than a count of calendar days from 20 November out to a February value date. Linear points equal spot times the rate gap times that fraction.
The spot is 10.71798, the gap is 0.020 and the fraction is 0.25, so 10.71798 times 0.020 equals 0.214360, and 0.214360 times 0.25 equals 0.05359 kroner per euro. Adding the points to the spot produces 10.77157 kroner per euro.
The covered-interest ratio is a second writing of the same two rates. One plus 0.045 times 0.25, divided by one plus 0.025 times 0.25, equals 1.01125 divided by 1.00625, or 1.004969. The spot times that factor is 10.77123, which sits 0.00033 kroner under the linear outright. The steps use the linear form because it is one multiplication, and the rates inside it are today's steering rates, so a longer fraction stretches today's gap and leaves any later path the banks publish outside the multiplication.
Step 6. Set the result beside what a dealing screen adds
A bank's three-month EUR/NOK outright is a traded price. The 10.77157 figure is the policy-rate piece of that price. Between them sit the cross-currency basis, the bid-offer on the screen, and any day-count that desk prefers to Actual/360. Basis is the extra spread the market adds when it borrows one currency and lends the other through the forward. It moves with demand for kroner funding and for euro funding, and a formula that contains only 4.5 percent and 2.50 percent leaves it out.
Spot at 10.71798 can sit still on the next Frankfurter row while the points change, the moment either bank replaces its rate, and the points can sit still across many of the 256 daily prints because the rates move on meeting days. The label "policy-rate forward" beside 10.77157 keeps that outright from being copied onto a forecast page as a target.
RelatedUSD/KES Price Prediction: 133.50 Bull vs 127.40 Bear
If the 17 December Norges Bank decision changes 4.5, or the ECB press conference that day changes 2.50, steps 2 and 5 run again, while the spot division waits on the next Frankfurter business day.
Step 7. Measure the oil co-movement on the daily changes
The oil sentence can be checked on the same dates as the cross. EIA's workbook for Europe Brent Spot Price FOB, series RBRTE, was downloaded on 22 November 2026 from the Brent spot spreadsheet. The contents sheet timestamps the workbook at 18 November 2026 and lists the latest observation as 17 November 2026, at 92.94 dollars a barrel. The row for 20 November 2025, the first day of the Frankfurter window, is 63.64 dollars. Across that span Brent rose 46.0 percent while euro-base EUR/NOK fell 8.71 percent.
The daily measure is a Pearson correlation of percent changes, computed in this session from the two files. Each series becomes a percent change against its own previous print, and a date is kept only when both series printed that day. The last 90 such dates run from 14 July 2026 to 17 November 2026, and the correlation is minus 0.250. Its square is 0.062, so about 6 percent of the variance in the paired daily moves lines up, and the other 94 percent sits elsewhere. The sign matches the oil-currency pattern, with EUR/NOK more often lower on days Brent rose, and the size is mild beside the rate gap and the basis.
The 5 November release already sets the stories side by side: oil spot prices had fallen while futures had increased somewhat, and the krone had appreciated and was stronger than assumed, beside an unchanged 4.5 percent. NOK/JPY separates an oil move from the yen value of the krone, the same split with a different quote currency.
Questions that sit past the arithmetic
Which ECB rate belongs in the gap?
The deposit facility is the steering rate, left at 2.50 percent on 29 October 2026, while main refinancing on the same row is 2.65 percent. Step 2 already runs that swap: the points fall from 0.05359 to 0.04957 kroner. Marginal lending, at 2.90 percent, remains the ceiling of the corridor and stays out of the steering gap.
Why divide the dollar legs instead of chaining through the euro-dollar price?
Both writings produce 10.71798 kroner per euro on 20 November 2026. The division uses 9.7525 and 0.90992 as Frankfurter returned them, and the chain inverts 0.90992 into 1.098998 dollars per euro before multiplying by 9.7525. The division is the shorter path from that download. They match only when the inverted leg and the kroner leg share a date.
What should change in the fraction for a one-month horizon?
Replace 90 with 30 and leave Actual/360 in place, so the fraction becomes 30/360, one twelfth. On the same 10.71798 spot and the same 0.020 gap, the points are 0.01786 kroner and the outright is 10.73584. The policy rates in the formula are still the current steering rates, so the shorter fraction compresses today's gap and still leaves any path for later meetings outside the sum.
Does a new rate decision rewrite the spot?
A new rate rewrites the gap and, through the gap, the points. The spot moves only when a later Frankfurter print moves. The year's low, 10.3120 on 30 October 2026, was already on the tape before Norges Bank published an unchanged 4.5 percent on 5 November. After 17 December 2026, a new rate on either bank's page sends steps 2 and 5 back through the multiplication.
Checklist
- Copy the Norges Bank policy rate and the ECB deposit facility from the banks' own pages, with the effective date beside each rate.
- Subtract the deposit facility from the policy rate and keep the result in decimal form. On the pages read here, that result is 0.020.
- Download euro-per-dollar and kroner-per-dollar from one Frankfurter response, for one date.
- Divide kroner per dollar by euro per dollar, and check the quotient against the euro-base print for that date.
- Multiply the quotient by the gap and by 90/360, name the convention Actual/360, and add the points to the spot.
- Beside the outright, note that a dealing screen also carries basis, a bid-offer and its own day-count.
- Recompute the 90-session correlation of daily percent changes against EIA Brent before treating a move in the barrel as the whole of the EUR/NOK cross.
This is analysis, not advice. Capital is at risk.