

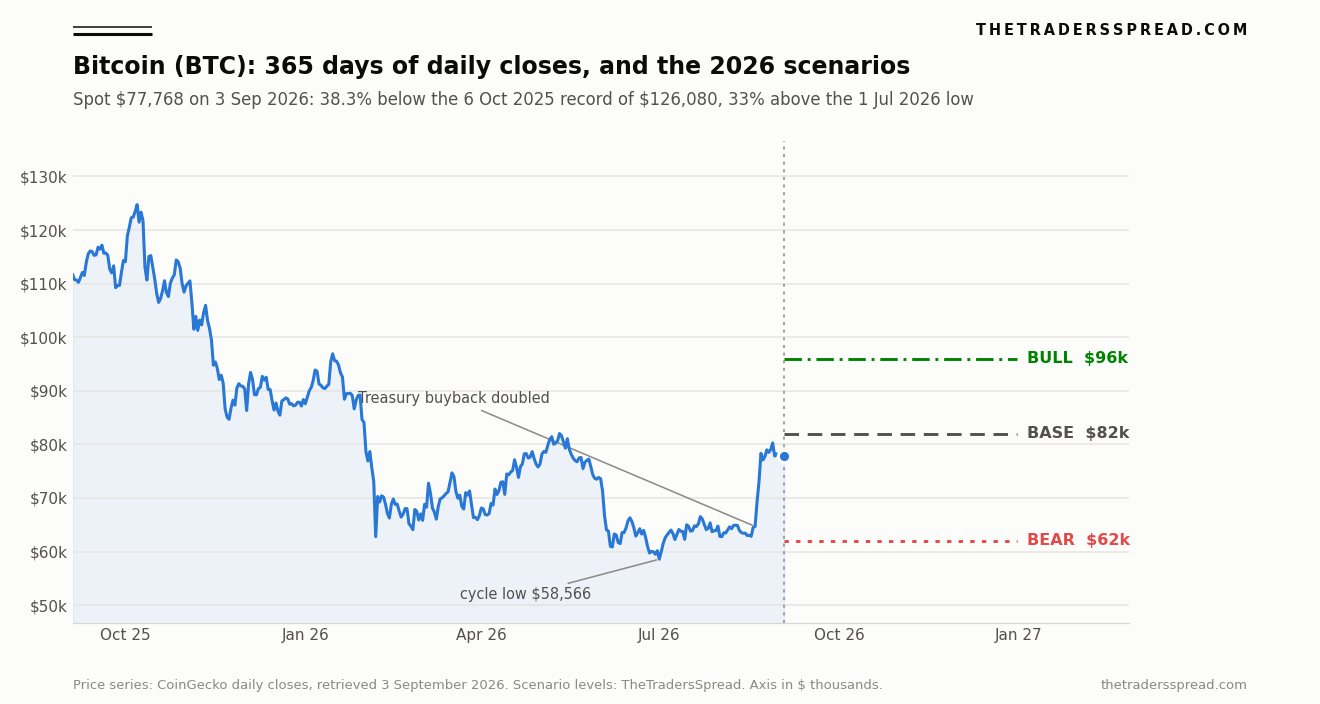
Bitcoin trades at $77,768, up 22.2% over thirty days and down 30.0% over twelve months (CoinGecko, 3 September 2026). Both figures describe the same asset on the same morning. Neither is a rounding artefact and neither cancels the other, so the coin sits in its best month since November 2024 while remaining almost a third poorer than it was last September, and 38.3% below the record close of $126,080 set on 6 October 2025. Anyone sizing a position here is choosing which window to weight, and that choice usually gets made before the analysis rather than after it.
The distance between the windows is the entire question. Thirty days shows recovery. Twelve months shows a bear market that has not resolved. Four years shows the shallowest cycle drawdown in Bitcoin's recorded history, which is either evidence that the buyer base has changed or evidence that the low was never properly tested.
Most of the coverage of the August rally skipped the part that decides which reading is right. The 22% month was not a month. Between the 4 August close of $63,465 and the 3 September close of $77,858, Bitcoin gained $14,393, and $13,632 of that arrived in three sessions between 19 and 22 August (CoinGecko daily closes, retrieved 3 September 2026). Remove those three days and the other twenty-seven sessions netted roughly 1.3%. A monthly performance number of that shape is not describing a trend. It is describing a gap, and gaps behave differently from trends: they persist only for as long as the repricing that caused them stays valid.
The repricing that caused this one has already been undone in the market where it started.
Key facts
- Bitcoin spot $77,768, market capitalisation $1.56trn, 20,078,937 coins in circulation — CoinGecko, 3 September 2026
- 38.3% below the 6 October 2025 record of $126,080; 32.8% above the 1 July 2026 cycle low of $58,566 — CoinGecko daily closes, 3 September 2026
- The US Treasury raised its long-end liquidity-support buyback cap from $2bn to at least $4bn per operation, effective 9 September and running through 4 November 2026 — US Treasury press release, 19 August 2026
- US spot Bitcoin ETFs took $3.52bn of net inflows in August against $172m in July, yet remain $1.77bn net negative for 2026 — SoSoValue data via Cointelegraph, 2 September 2026
- Strategy held 845,050 BTC at an average cost of $75,412 as of 30 August, having bought its most recent 4,603 coins at an average $80,318 — Strategy Inc Form 8-K, filed 31 August 2026
- Deribit's DVOL index closed at 36.84 on 3 September against 30-day realised volatility of 42.2% — Deribit API and CoinGecko closes, retrieved 3 September 2026
- Prior cycle bear markets ran 71% to 85% peak-to-trough; this one stopped at 53.1% — Bitstamp BTC/USD daily closes, retrieved 3 September 2026
The three sessions that were the month
On 19 August the US Treasury announced that the maximum size of its liquidity-support buyback operations in the 10-to-20-year and 20-to-30-year nominal sectors would rise from $2bn per operation to "at least $4 billion per operation", effective 9 September and in force through 4 November 2026 (US Treasury, 19 August 2026). The mechanism is unglamorous: Treasury buys back off-the-run long bonds, dealer balance sheets free up, and the term premium compresses. Crypto read it as a liquidity signal within the hour. Bitcoin moved from an intraday $64,100 to $69,500 in under twelve hours, and roughly $1.44bn of shorts were liquidated in twenty-four hours, $1.29bn of it inside a single hour across more than 110,000 accounts (CoinGlass data via crypto.news, 20 August 2026).
By the time the squeeze finished on 20 August, total crypto liquidations had passed $3bn, of which about $2.77bn were shorts and roughly $264m were longs (CoinGlass via crypto.news, 20 August 2026). A 92/8 split is not a market absorbing new information in an orderly way. It is a market in which positioning had become one-sided enough that a modest macro headline produced a forced-buying cascade. Bitcoin's daily close went $64,686 on 19 August, $69,291 on 20 August, $73,021 on 21 August, $78,318 on 22 August, a 21.1% three-session gain from a starting point that had barely moved in six weeks.
"Bitcoin is the canary in the macro coal mine," said Andre Dragosch, head of research at Bitwise, of the reaction (crypto.news, 20 August 2026). Paul Howard, senior director at Wincent, framed the same move more narrowly, saying the Treasury change offered "a more supportive backdrop for risk-taking and short-term speculation in crypto".
Both descriptions can be true and still leave the position question open, because a canary and a speculative backdrop imply very different holding periods. Ether ran 26% over the same August window, which tells you the bid was broad rather than Bitcoin-specific, and broad crypto beta on a rates headline is closer to Howard's reading than to Dragosch's.
A rates round trip Bitcoin never made
Here is where the trade gets interesting, and where the constant-maturity data does most of the work. On 18 August, the day before the announcement, the 30-year Treasury yield stood at 5.28% and the 10-year at 4.71%. On 19 August they fell to 5.19% and 4.65% (Federal Reserve Economic Data, series DGS30 and DGS10, retrieved 3 September 2026). That was the trigger. By 1 September the 30-year was back at 5.27% and the 10-year had gone to 4.79%, which is nine basis points higher than it was before the Treasury said anything. The 10-year real yield, the cleanest available discount rate for a zero-cashflow asset, tells the same story: 2.41% on 18 August, 2.35% on 19 August, 2.44% on 1 September (FRED series DFII10).
The bond market gave the whole thing back within nine sessions. Bitcoin did not give back a cent of it.
There are two honest readings of that divergence. The first is that Bitcoin was not really pricing the buyback at all: it was pricing the removal of a large, crowded short, and once that inventory was gone the price simply stayed where the forced buying left it. The second is that crypto is discounting something the Treasury curve has not yet accepted, namely that a Treasury willing to double buybacks when the 30-year touches 5.31% (its 17 August level, the highest since 2007) has revealed a yield ceiling it intends to defend. The first reading implies the $78,000 shelf is an artefact of positioning and decays. The second implies it is a floor.
Evidence for the first is that the 10-year real yield is now above where it started and Bitcoin has held anyway; an asset that genuinely trades off real rates does not shrug at a nine-basis-point round trip in the wrong direction. Evidence for the second is that the buyback programme has not begun. The larger operations start on 9 September and run to 4 November, so the flow that supposedly justified the move has not yet touched the market. The market has front-run a mechanism it will only observe in September and October, which makes those two months the test rather than the confirmation.
Drawdown arithmetic
Cycle comparison is where Bitcoin analysis most often turns into pattern-matching, so precision about what the record contains matters. Using Bitstamp's BTC/USD daily closes back to 2011, the four completed cycle bear markets and the current one look like this.
| Peak (close) | Trough (close) | Drawdown | Days peak to trough | Days trough to new high |
|---|---|---|---|---|
| 9 Apr 2013, $229 | 6 Jul 2013, $66 | -71.0% | 88 | 122 |
| 4 Dec 2013, $1,132 | 14 Jan 2015, $171 | -84.9% | 406 | 771 |
| 16 Dec 2017, $19,188 | 15 Dec 2018, $3,180 | -83.4% | 364 | 716 |
| 8 Nov 2021, $67,559 | 21 Nov 2022, $15,766 | -76.7% | 378 | 469 |
| 6 Oct 2025, $124,728 | 30 Jun 2026, $58,526 | -53.1% | 267 | 65 and counting |
Source: Bitstamp BTC/USD daily closes, retrieved 3 September 2026. Peak and trough values are closing prices, which is why the 2025 peak reads $124,728 against the $126,080 intraday record CoinGecko carries.
Two things fall out of that table and they point in opposite directions. The current drawdown is the mildest on record by a wide margin, 53.1% against a prior range of 71% to 85%, and the fastest to reach its low, 267 days against 364 to 406 for the three modern cycles. Structural bulls read that as ETF and corporate demand truncating the downside. The bearish reading is simpler: a shallower fall removed less leverage, and every prior cycle that ended at 76% or worse spent months grinding sideways at the low rather than leaving it in three sessions.
The recovery column carries the constraint that matters most for a year-end target. The three modern cycles took 469, 716 and 771 days to make a new high from the trough. Bitcoin is 65 days past its 30 June low. Nothing in that record supports a 2026 return to $126,080, and any bull case for the next four months has to live comfortably below the old high or it is arguing that this cycle breaks the only pattern the asset has ever kept.
The buyer of record, and what it paid
Flow data for August looks unambiguous until you extend the window. US spot Bitcoin ETFs pulled in $3.52bn of net inflows during the month against $172m in July, took inflows on 16 of 21 trading days including nine consecutive sessions from 17 to 27 August, and lifted total net assets from $76.29bn to $99.61bn (SoSoValue data via Cointelegraph, 2 September 2026). It still leaves the complex $1.77bn net negative for 2026, improved from $5.29bn but negative. On 1 September the funds shed $236.46m in a single session, 85% of it from BlackRock's IBIT.
The best ETF month of the year did not make the ETF year positive. It made it less negative.
The corporate bid tells a sharper version of the same story. Strategy Inc disclosed holdings of 845,050 BTC as of 30 August at an aggregate cost of $63.73bn, an average of $75,412 per coin, having acquired its most recent 4,603 coins during the week of 24 to 30 August at an average of $80,318, funded by $369.7m of net proceeds from at-the-market sales of its own common stock (Form 8-K, filed 31 August 2026). That stack is 4.21% of circulating supply. At $77,768 it is worth $65.72bn, which puts the whole position 3.1% above cost after five years of accumulation, while the newest tranche sits 3.2% underwater.
Nobody bought the August low. The largest identifiable non-fund buyer in the market bought the August high, with equity issued at a premium that only exists while the coin is rising, and that reflexivity is what makes the $75,412 average cost a level worth watching rather than trivia. Below it, a company that has spent half a decade telling shareholders the strategy works has to explain an unrealised loss on 4.21% of all Bitcoin. Our earlier read on that cost-basis proximity and on what the $80,000 level does to crypto-levered equities point at the same fragility from the equity side. For scale on the fund side, Solana's ETF complex holds $1.06bn against Bitcoin's $99.61bn.
Volatility priced below what August delivered
Options are the one place where a forward view is quoted rather than inferred, and right now that quote is low. Deribit's DVOL index, which reads 30-day implied volatility off the BTC options surface, printed a six-month low of 33.83 on 7 August, spiked to an intraday 47.14 on 21 August as the squeeze ran, and closed at 36.84 on 3 September (Deribit API, retrieved 3 September 2026). Realised volatility over the trailing thirty calendar days, computed from CoinGecko daily closes and annualised, is 42.2%. Ninety-day realised is 35.8% and 365-day is 43.8%.
So the options market is asking 5.4 volatility points less for the next month than the last month actually delivered. That is a defensible quote if the three-session gap was a one-off dislocation and the market reverts to its June-July character. It is a poor one if the buyback starting 9 September produces anything resembling the 19 August reaction, or if it disappoints and the gap unwinds. Either outcome is a large move; only the sign differs.
Implied below realised at a cycle turn is the market saying the interesting part is over. That claim has a start date attached to it, which is unusual and useful.
The disconfirmation case
The strongest argument against everything above is that positioning-driven moves are not automatically fragile. The 19 August squeeze removed roughly $2.77bn of short inventory permanently; that supply does not return unless new sellers replace it, and twelve sessions of consolidation between $77,000 and $80,268 suggest the market absorbed the repricing rather than rejecting it. A gap that holds for two weeks against a fully retraced rates move is doing something a purely mechanical squeeze would not.
Seasonality cuts the other way and deserves a hearing precisely because it is unfashionable. Across prior years September has averaged -2.86% for Bitcoin with a median of -2.44% (The Crypto Times, 1 September 2026). A thirteen-observation seasonal average is not a forecast, but it is consistent with the flow reversal already visible on 1 September.
RelatedCosmos (ATOM) Price Prediction: $2.44 Bull vs $1.40 Bear
The concentration problem would change the structure rather than the price. IBIT accounted for 85% of the 1 September outflow, which means the marginal daily bid and the marginal daily offer in the ETF complex are increasingly the same fund. Comparable single-name concentration in a smaller asset would be read as a red flag; here it is reported as institutional adoption.
The call
Base case, 45%: Bitcoin spends the fourth quarter between $70,000 and $88,000, with $82,000 as the central estimate. The reasoning is that the August gap holds because the short inventory that fed it is genuinely gone, but nothing in the flow data supports a second leg. ETF demand is positive month-to-month and negative year-to-date, the corporate bid is buying above its own average, and the cycle record says a new high is a 2027 or 2028 event rather than a 2026 one.
Bull case, 25%: $96,000 by 31 December. This needs the September and October buyback operations to actually compress long-end yields rather than merely being announced, pulling the 10-year real yield back below 2.30% and giving the risk bid a second reason to exist. The path runs through the December-2025 and January-2026 supply shelf between $84,000 and $97,000, and $96,000 sits just under the 15 January 2026 high of $96,899, which is where sellers who bought that shelf are waiting. Note what this bull case is not: it is still 23.9% below the record.
Bear case, 30%: $62,000, a full retracement of the three-session gap to the pre-announcement shelf where Bitcoin closed at $62,773 on 2 August and $62,844 on 17 August. The trigger would be the buyback starting on 9 September and doing nothing observable to the long end, combined with September ETF outflows continuing at the 1 September pace. The first level on the way down is $75,412, Strategy's average cost, roughly 3% below spot.
What would change this read: two consecutive weeks of ETF inflows above $900m alongside a 10-year real yield below 2.30% would retire the bear case and move probability into the bull column. A weekly close below $70,000 would do the reverse, confirming that the August repricing was inventory rather than information. The same framework applied to a slower-moving asset is in our XRP scenario work.
Frequently asked questions
Why is Bitcoin up 22% in a month but down 30% on the year?
The two windows capture different events. The twelve-month figure spans the collapse from the October 2025 record of $126,080 down to the June 2026 low of $58,526. The thirty-day figure captures only the rebound that followed, and almost all of that rebound landed in three sessions in late August. Neither number is wrong; they simply measure different halves of the same cycle.
What actually triggered the August 2026 rally?
The US Treasury announced on 19 August that it would at least double its long-end buyback operations from $2bn to $4bn each, effective 9 September. Crypto read that as a liquidity signal, and the move forced roughly $2.77bn of short positions to close within twenty-four hours. The squeeze, rather than the buyback itself, produced most of the price gain.
Is this drawdown different from previous Bitcoin bear markets?
Measurably. At 53.1% peak-to-trough on closing prices it is the mildest of the five recorded cycle drawdowns, against 71% to 85% previously, and at 267 days it was also the quickest to reach its low. Whether that reflects a structurally stronger buyer base or an incomplete washout is the central disagreement in the market right now.
How close is Strategy to being underwater on its Bitcoin?
Very close. Its 845,050 coins carry an average cost of $75,412 as of 30 August 2026, roughly 3% below the current $77,768 spot price. Its most recent purchase, 4,603 coins at an average $80,318, is already showing an unrealised loss. That average cost is a level worth tracking because of the equity-issuance loop it sits inside.
What does the options market expect for the next month?
Less movement than the last month produced. Deribit's DVOL index closed at 36.84 on 3 September against 42.2% realised volatility over the trailing thirty days. Implied sitting below realised generally signals that participants expect the recent dislocation to fade rather than repeat, which makes the 9 September buyback start date the obvious point of disagreement.
Disclaimer
This article is analysis and information, not investment advice, and no part of it is a recommendation to buy, sell or hold any asset. Scenario levels are the author's own estimates and carry no guarantee of accuracy. Cryptocurrency prices are volatile and capital is at risk, including the risk of total loss. Readers should conduct their own research before making financial decisions.