

The easy reading of MicroStrategy (MSTR) closing at $127.31 on Friday 28 August 2026, down 7.34% on the session, is that the market has simply stopped believing in bitcoin. That reading does not survive contact with the filings. Strategy Inc, the company MSTR still trades under, holds 840,447 bitcoin at a blended cost of $75,385. With bitcoin at $77,701, that stack is 3.07% above what was paid for it — a $63.36 billion book carrying roughly $1.94 billion of unrealised gain after four years of accumulation. The bitcoin has not broken. What has broken is the relationship between the company and the coin it holds. MSTR sits 64.6% below its 6 October 2025 peak of $359.69. Bitcoin sits 38.4% below its own all-time high of $126,080, set on exactly the same day. The wrapper has fallen 1.68 times as far as the thing it wraps.
Here is the part that almost nobody states correctly, and it cuts both ways. On the headline arithmetic, MSTR's common equity is worth less than its bitcoin: roughly 415.5 million shares at $127.31 is about $52.9 billion of market capitalisation against $65.3 billion of bitcoin, a gross multiple of net asset value of 0.81 — a 19% discount. That number is doing the rounds, and on its own it is misleading, because it silently ignores the $22.2 billion of claims that rank ahead of the common. Deduct the $6.71 billion of debt and the $15.46 billion liquidation preference on the preferred stack from the bitcoin plus the $6.69 billion of dollar liquidity, and the residual claim of the common is about $49.8 billion, or $119.90 a share. At $127.31 the stock is therefore trading at roughly 1.06 times its look-through net asset value — a 6% premium, not a 19% discount. Both numbers come from the same filings. The discount to gross bitcoin is real; the discount to what shareholders actually own is not. The premium has not inverted. It has simply been compressed to almost nothing, which for a company whose entire funding model depends on issuing equity above net asset value is the more consequential fact.
Key facts
- MSTR closed at $127.31 on 28 August 2026, down 7.34% from $137.40, on 31.3 million shares — stockanalysis.com daily data, pulled 29 August 2026.
- Strategy holds 840,447 BTC at an average purchase price of $75,385, aggregate cost $63.36 billion — Form 8-K, filed 24 August 2026.
- The 8-K states plainly: "No bitcoin purchases or sales were made this week" for the period 17–23 August 2026 — Form 8-K, 24 August 2026.
- Bitcoin traded at $77,701, 38.4% below its $126,080 record of 6 October 2025 — CoinGecko, 29 August 2026.
- Strategy sold 18,261,118 MSTR shares for $2,006.5 million in that same week and put none of it into bitcoin — Form 8-K, 24 August 2026.
- Preferred dividends of $400.7 million in Q2 2026 were 3.27 times the company's $122.4 million of quarterly revenue — Form 8-K Exhibit 99.1, 30 July 2026.
- Bitcoin per share fell 7.90% in the month to 23 August, from 2.1960 to 2.0225 BTC per thousand shares — derived from the weekly 8-K disclosures.
What actually happened in the session to 28 August
The move needs framing honestly, because the single-day number flatters the bears. MSTR fell 7.34% on Friday 28 August, but that came immediately after an 11.54% rally on Thursday 27 August. Across the two sessions the stock is net up 3.34%, and measured from the previous Friday's $119.25 close it finished the week 6.76% higher. This was not a capitulation day. It was a violent give-back inside a violent week, on 31.3 million shares, in a stock that has spent August oscillating between $82 and $137.
What made the session interesting was the context supplied four days earlier. On 24 August, Strategy filed the weekly Form 8-K it has used since 2020 to report treasury activity. The bitcoin table carried a single footnote: no purchases or sales were made that week. Holdings stayed at 840,447 BTC, aggregate cost $63.36 billion, average price $75,385 — unchanged from the prior week's filing.
It would be wrong to call a zero-purchase week unprecedented. It is now the norm. Walking back through the filings, the last time Strategy actually bought bitcoin was the week of 15–21 June 2026, when it acquired 520 BTC at an average of $67,068. Every weekly report since has shown either no purchase or an outright sale. Across four disposal weeks the company sold 1,363 coins on 29–30 June, 2,225 on 1–5 July, 1,638 on 27 July–2 August and 1,690 on 3–9 August: 6,916 bitcoin in total, which reconciles exactly to the fall in holdings from 847,363 to 840,447.
The disposals carry a detail worth pausing on. Aggregate cost fell from $64.10 billion to $63.36 billion across those 6,916 coins — $107,000 of cost basis removed per coin sold, against a blended average of about $75,400. Strategy has been disposing of its highest-cost tax lots, the coins bought closest to the 2025 top, not an average slice of the stack. That is standard specific-identification practice, and it explains why the reported average purchase price has drifted down from $75,651 to $75,385 while the company sold at prices between $59,256 and $64,262.
Michael Saylor, Founder and Executive Chairman at Strategy Inc, framed the shift in the company's own words on the Q2 release: "In the midst of this phase of muted bitcoin sentiment and market skepticism, we continue to evolve our business model and establish Digital Credit as a new asset class," he said in the 30 July 2026 earnings release. The accumulation story has been formally replaced by a credit story. Traders positioning MSTR as a leveraged bitcoin proxy, in the way described in our coverage of how single-asset vehicles track their underlying, are trading a company that has stopped doing the thing the proxy assumed.
Where the $2 billion went instead
The same 8-K that reported zero bitcoin activity reported the largest single week of equity issuance in the sequence. Strategy sold 18,261,118 MSTR shares under its at-the-market programme between 17 and 23 August for $2,006.5 million of net proceeds. For scale, the previous six weeks combined raised $2,552.1 million on 26,036,168 shares; this one week accounted for 41.2% of the seven-week share total.
The filing is explicit about the destination. Of the $2,006.5 million, $136.4 million funded repurchases of STRC preferred stock, $300.0 million increased the USD Reserve, and the balance — a little over $1.57 billion — went into "USD Cash", a liquidity pool the company established that same day as a new component of its Digital Credit Capital Framework. As of 23 August the USD Reserve stood at $5.10 billion and USD Cash at $1.59 billion.
Read the flow in one line: the company issued $2 billion of common stock and converted it into dollars and preferred buybacks. For five years the mechanism ran the other way, and that reversal is the event. The preferred stack is why. Strategy now has five listed securities on Nasdaq — MSTR common plus STRF, STRC, STRK and STRD preferreds — and the preferred carries a $15.46 billion liquidation preference against which dividends of $400.7 million were charged in Q2 alone. Set that against $122.4 million of quarterly revenue from the software business and the ratio is 3.27 to one. The operating company cannot service the capital structure; only the treasury or the equity market can.
Andrew Kang, Chief Financial Officer at Strategy Inc, addressed the coverage directly: "Strategy's USD Reserve currently stands at $3.75 billion, which is enough to cover our existing preferred dividend payments and interest obligations for more than 2.1 years. We've also built a track record of 18 months of consecutive dividend payments, having never missed a dividend despite the recent deep drawdown in bitcoin price," he said on 30 July. The reserve has since been built from $3.75 billion to $5.10 billion, with $1.59 billion of USD Cash beside it. That is a deliberate, disclosed decision to hold dollars rather than coins, and it is the correct decision for a preferred holder. It is a different decision for a common holder who bought the vehicle for bitcoin exposure.
The arithmetic, and what a share now claims
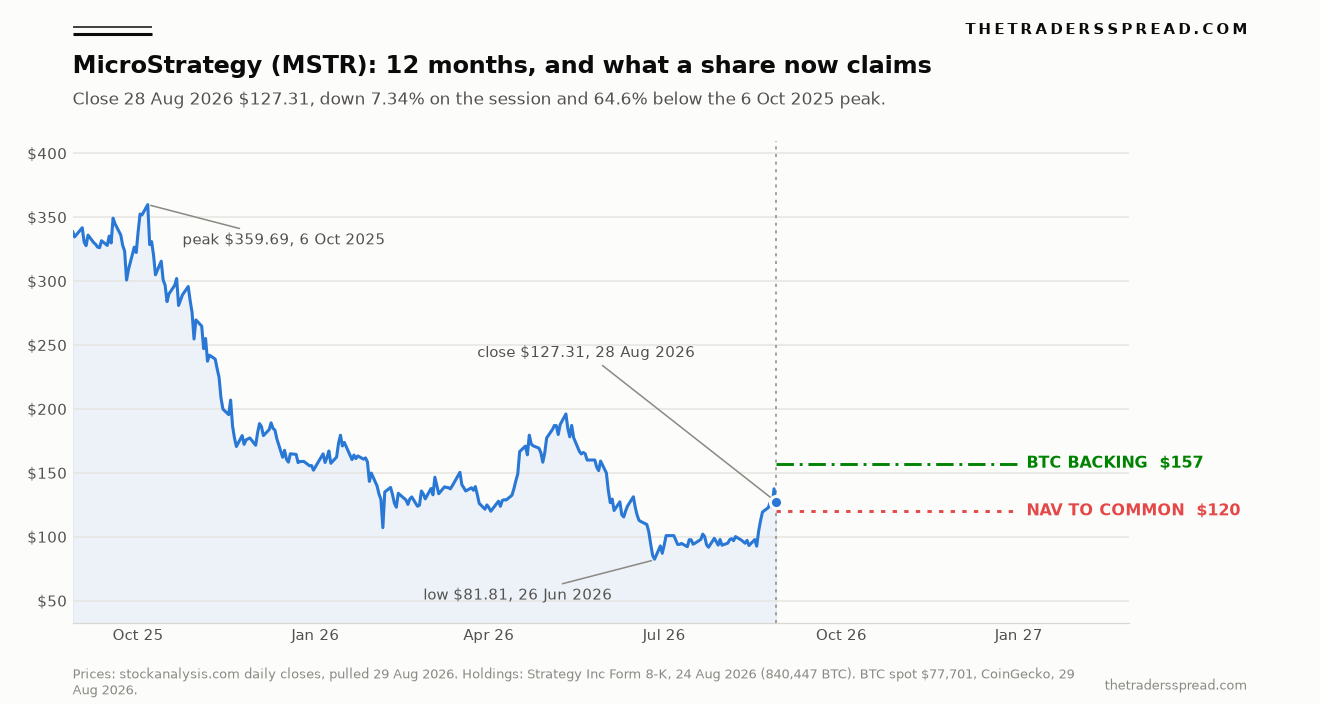
The chart plots twelve months of MSTR closes against two reference levels drawn from the filings rather than from any forecast. The upper line, $157.15, is the gross bitcoin held per share at Friday's spot. The lower line, $119.90, is what is left for the common after debt and the preferred liquidation preference. The close sits between them, which is the whole story in one picture.
Share count is the one figure that requires an estimate, and the method matters. The Q2 Form 10-Q cover page reports 364,585,501 class A and 19,640,250 class B shares outstanding as of 24 July 2026. Adding the 31,317,027 ATM shares disclosed in the four weekly 8-Ks since gives approximately 415.5 million. That excludes equity-plan issuance and any conversion activity, so treat it as a floor; the company's own count arrives with the Q3 10-Q.
| Measure | On 10-Q count (384.2m) | Incl. disclosed ATM (415.5m) |
|---|---|---|
| Market capitalisation at $127.31 | $48.92bn | $52.90bn |
| Bitcoin held (840,447 BTC at $77,701) | $65.30bn | $65.30bn |
| Gross mNAV (market cap ÷ bitcoin) | 0.749 | 0.810 |
| Residual NAV per share after debt and preferred | $129.67 | $119.90 |
| Price ÷ residual NAV | 0.98 | 1.06 |
| Bitcoin per 1,000 shares | 2.1876 | 2.0225 |
Combining the equity issuance table with the bitcoin table produces the number that neither table shows on its own. On 24 July, Strategy held 843,775 BTC against 384.2 million shares: 2.1960 bitcoin per thousand shares. By 23 August it held 840,447 against roughly 415.5 million: 2.0225. Shares rose 8.15%, coins fell 0.39%, and bitcoin per share dropped 7.90% in a single month. Strategy's own headline KPI, BTC Yield, was reported at 4.5% for the year to 26 July. The four weeks that followed worked against it.
The issuance prices explain why. Net proceeds per share across the seven disclosed weeks ran from $96.44 to $109.88 — every one of them below the $119.90 residual net asset value per share and far below the $157.15 of gross bitcoin backing. Issuing stock beneath net asset value and holding the proceeds in dollars dilutes the residual claim of existing holders by construction. When the same machinery ran at two or three times net asset value and bought coins with the proceeds, it did the opposite. That is not a change of sentiment. It is a change of sign.
Accounting and disclosure pressure
Three structural features shape how this is reported, and each amplifies the volatility rather than dampening it.
First, fair-value accounting. Since the adoption of ASC 2023-08, bitcoin is carried at fair value with unrealised movements running through earnings. Strategy's Q2 operating loss of $8.33 billion contained an $8.32 billion unrealised loss on digital assets; the equivalent quarter of 2025 carried a $14.05 billion unrealised gain. Net loss for Q2 2026 was $8.22 billion, or $24.45 per diluted share, and $8.62 billion attributable to common after preferred dividends. Retained earnings of $6.32 billion at 31 December 2025 became an accumulated deficit of $15.20 billion by 30 June 2026 — a $21.52 billion swing in six months driven almost entirely by a mark, not by cash.
Second, the classification of the preferred. The 10-Q states that under ASC 480 each series outstanding at 30 June 2026 is carried in mezzanine equity, because events that could trigger redemption are not solely within the company's control. Carrying value was $14.44 billion against a redemption and liquidation preference of $15.46 billion. Anyone computing net asset value from the balance-sheet equity line alone will overstate what the common owns; the liquidation preference is the number that binds.
Third, the disclosure cadence itself. Strategy files an 8-K every Monday covering the prior week's treasury and issuance activity, far more granular than any peer offers. That means the market re-prices the treasury on a weekly clock, and a filing showing dollars raised and no coins bought is a legible signal on that clock. The rates backdrop we covered in the September Federal Reserve decision feeds directly into it, because the preferred coupon is fixed while the collateral value is not — Kang's disclosed BTC Hurdle ARR of 10.8% is the company's own estimate of that effective cost of credit.
What this changes
The first consequence is definitional. A vehicle that raises equity and buys bitcoin is a leveraged bitcoin instrument. A vehicle that raises equity, holds dollars and buys back its own preferred is a closed-end credit structure with a bitcoin collateral pool. Those are different instruments with different sensitivities, and only one of them is what most MSTR positions were originally sized for. Anyone modelling MSTR as beta to bitcoin should note that beta is now filtered through a $15.46 billion preference and a $6.71 billion debt stack whose claims do not move with the coin.
RelatedHelen of Troy Earnings: HELE Rose 3.9% at the Close
The second is the reflexivity of the funding model. It worked because the market paid a premium to net asset value, letting each share issued buy more bitcoin per share than it diluted. At roughly 1.06 times residual net asset value, that engine has almost no clearance. Persistent issuance at or below net asset value transfers value from common holders to the balance sheet, which is defensible when the balance sheet must fund $1.6 billion of annualised preferred dividends against $490 million of annualised revenue, but it is not the trade the common was sold on.
The third is the 3.07% cushion. At $77,701 the stack is barely above its $75,385 blended cost. A move to $75,385 would take the unrealised gain to zero; below that, the four-year accumulation is under water in aggregate, and the largest single bitcoin holder among listed companies becomes a forced storyteller in a way it has never yet had to be. That threshold is 3.0% below Friday's spot, and it is the single most watchable number in this structure.
What to watch next is specific and dated. The Monday 8-K each week now carries three lines that matter: whether any bitcoin was bought or sold, how many shares the ATM issued, and where the proceeds went. A week that shows coins bought with ATM proceeds restores the old mechanism. A week that shows more disposals to fund dividends confirms the new one. Beyond that, the Q3 10-Q will publish the true share count and settle the mNAV question that this analysis can only estimate, and the repurchase programmes — $516.6 million of preferred capacity and $1.0 billion of common capacity remaining as of 23 August — will show whether management treats its own discount as the better use of capital than the asset it built the company around. For how single-session moves in large-cap technology resolve over subsequent weeks, our records of the Nvidia guidance session and the Okta scenario work offer the comparison set.
FAQ
How much did MicroStrategy (MSTR) fall, and over what window?
MSTR closed at $127.31 on Friday 28 August 2026, down 7.34% from the previous close of $137.40, on volume of 31.3 million shares. That is a single-session move. It followed an 11.54% gain on 27 August, so across the two sessions the stock was net 3.34% higher, and it finished the week 6.76% above the prior Friday's $119.25 close.
How much bitcoin does Strategy hold and what did it pay?
840,447 BTC at an aggregate purchase price of $63.36 billion, an average of $75,385 per coin, as disclosed in the Form 8-K filed 24 August 2026 covering the week to 23 August. At the $77,701 spot recorded on 29 August that stack is worth about $65.30 billion, or 3.07% above cost.
Is it unusual for Strategy to buy no bitcoin in a week?
No — it has become routine. The last disclosed purchase was 520 BTC in the week of 15–21 June 2026. Every weekly filing since has reported either no activity or a sale, and the company disposed of 6,916 coins across four of those weeks, reducing holdings from 847,363 to 840,447.
Does MSTR trade at a discount to its bitcoin?
On gross bitcoin, yes: roughly $52.9 billion of market capitalisation against $65.3 billion of coins is a 19% discount. Measured against what the common actually owns after $6.71 billion of debt and a $15.46 billion preferred liquidation preference, the same price is about 1.06 times net asset value — a small premium. Both figures derive from the same filings and the difference is the capital structure.
Why does bitcoin per share matter more than total holdings?
Because holdings are the numerator and the share count is the denominator, and only one of them has been moving. Between 24 July and 23 August the share count rose an estimated 8.15% while coins fell 0.39%, cutting bitcoin per thousand shares from 2.1960 to 2.0225, a 7.90% decline. Strategy publishes BTC Yield as a headline metric precisely because that ratio, not the absolute stack, is what a shareholder holds.
Where can the underlying numbers be checked?
All treasury and issuance figures come from Strategy Inc's weekly Form 8-K filings and its Q2 Form 10-Q on the SEC's public archive. Share prices come from stockanalysis.com daily data and the bitcoin spot from CoinGecko, both pulled on 29 August 2026.
Disclaimer: this article is analysis and information only. It is not investment advice, and it is not a recommendation to buy, sell or hold any security or digital asset. Figures are sourced from public filings and market data pulled on 29 August 2026 and will change. Share counts after 24 July 2026 are estimated from disclosed at-the-market issuance and are not company-confirmed. Trading and investing carry risk, and capital is at risk.