

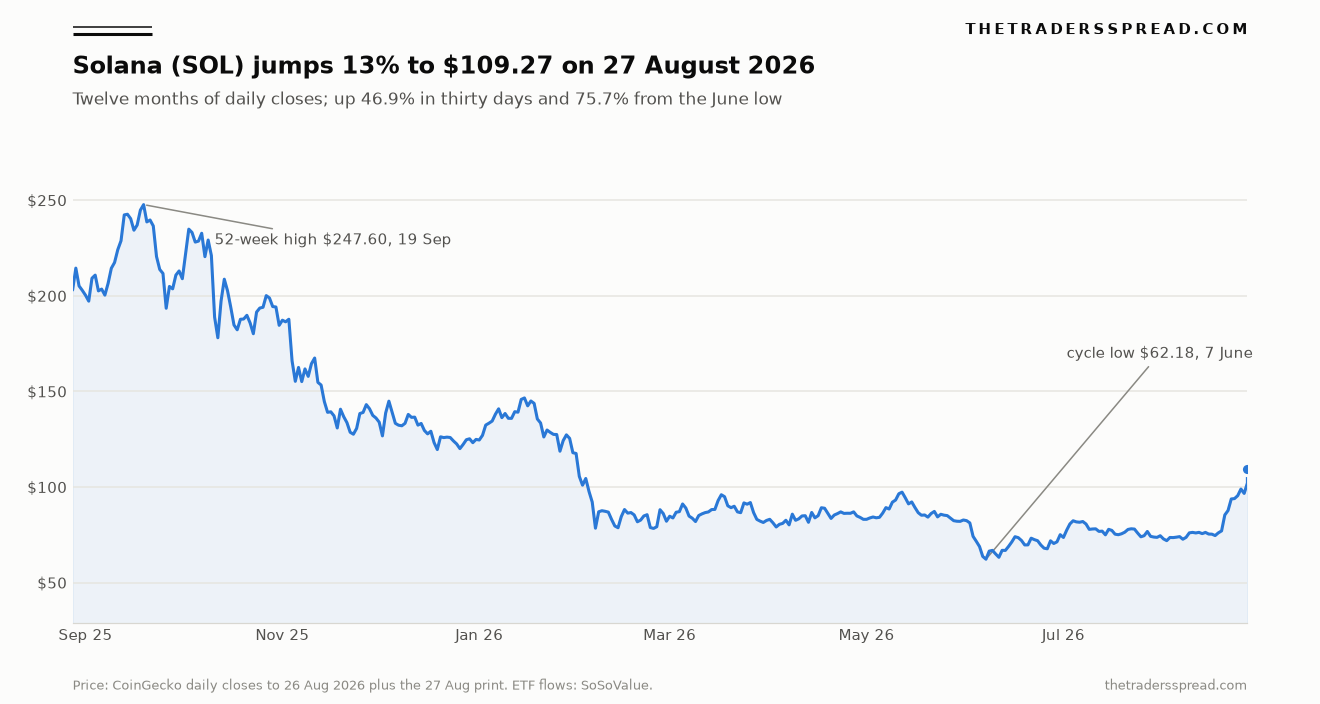
The Solana rally is being credited to its exchange-traded funds, and the arithmetic does not support it. Solana (SOL) traded at $109.27 on 27 August 2026, up 13.0% in twenty-four hours, 46.9% over thirty days and 75.7% from the $62.18 low set on 7 June. Over the same stretch, spot Solana ETFs accumulated total net assets of $1.06 billion against cumulative inflows since launch of $1.18 billion, according to SoSoValue. Set that against Solana's $6.88 billion of spot turnover in the past twenty-four hours alone and the scale problem is immediate: every dollar ever committed to a Solana ETF, since the first one listed, adds up to roughly four hours of spot trading. That is not a fund complex setting a price. That is a fund complex along for the ride.
What actually moved on 27 August was risk appetite, and it moved everywhere at once. Bitcoin rose 3.2% to $80,494 on the same day that Nvidia gained 9.3% and Solana gained 13.0%. A token that moves four times Bitcoin's daily percentage in the same session is not responding to an idiosyncratic catalyst; it is functioning as the high-beta expression of a market-wide impulse. That distinction matters enormously for anyone sizing a position, because it tells you what would end the move. If SOL is rallying on ETF adoption, the flows are the thing to watch. If it is rallying as leveraged beta to a risk-on tape that also lifted a semiconductor stock 9.3%, then the thing to watch is the tape — and Solana will give back multiples of whatever Bitcoin gives back when it turns.
Key Facts: Solana at a Glance
- SOL $109.27, up 13.04% in 24 hours, with a 24-hour range of $96.39–$109.31 — CoinGecko, 27 August 2026
- Up 46.93% over 30 days and 24.62% over 7 days, but still down 47.41% year-on-year — CoinGecko, 27 August 2026
- Market capitalisation $63.83 billion, ranked 7th, on 24-hour volume of $6.88 billion — CoinGecko, 27 August 2026
- Spot Solana ETF net assets $1.06 billion, cumulative inflows $1.18 billion, or 2.08% of market capitalisation — SoSoValue via CoinGape, 21 August 2026
- 52-week range $62.18 to $247.60; SOL remains 62.7% below its January 2025 record of $293.31 — CoinGecko
- 90-day realised volatility 59.1% annualised, against 55.2% over 30 days — The Traders Spread calculation on CoinGecko daily closes
- Circulating supply 584.06 million of 632.97 million total — CoinGecko, 27 August 2026
What Happened, and Over What Window
Solana bottomed at $62.18 on 7 June 2026, a level that undid more than two years of price appreciation. The recovery from there has been steady rather than explosive for most of the summer — the token spent June and July grinding between roughly $70 and $85 — before accelerating sharply in the final week of August.
The specific sequence matters. SOL closed at $90.98 on 21 August. Six sessions later it printed $109.27, a gain of 20.1% in under a week, with 13.0% of that arriving in the final twenty-four hours. The 24-hour low of $96.39 against a high of $109.31 describes a session that trended in one direction from the open, which is characteristic of short covering rather than accumulation.
Context is essential here, and it is the part most coverage omits. Despite a 46.9% monthly gain, Solana is down 47.4% over twelve months and sits 62.7% below its January 2025 record of $293.31. A token can be the best-performing large asset of the month and still be less than half what it was a year ago. Both facts are true, and only reporting the first produces a badly distorted picture of what has actually been recovered. The live prices on our markets page show the same divergence across the wider crypto desk.
The ETF Complex, Measured Rather Than Asserted
Spot Solana exchange-traded funds are real, listed and taking money. On 21 August they drew net inflows of $14.59 million across three products — Grayscale's GSOL at $7.14 million, Bitwise's BSOL at $6.57 million and VanEck's VSOL at $877,630 — on total ETF trading volume of $75.52 million, per SoSoValue. Cumulative inflows since launch stand at $1.18 billion and total net assets at $1.06 billion.
Those are respectable numbers for a product category barely a year old. They are also, on any honest comparison, too small to be the mechanical driver of a 13% single-day move in a $63.8 billion asset. The ETF complex's entire net asset base amounts to about 1.7% of Solana's market capitalisation. Its total daily trading volume of $75.52 million equals roughly 1.1% of the $6.88 billion that changes hands in spot markets in a day. Even the strongest single inflow day reported this month, around $33.5 million, represents under half of one percent of one day's spot turnover.
The correct reading is that ETF flows are a sentiment indicator rather than a price mechanism at this scale. They tell you that regulated allocators are willing to hold Solana, which is genuinely new information about the asset's institutional acceptance. They do not tell you that those allocators are the marginal buyer. Confusing the two leads directly to the wrong risk model: an investor who believes ETF demand is setting the price will hold through a drawdown expecting flows to cushion it, and the flows are two orders of magnitude too small to do that.
The issuer split is worth noting for what it says about distribution rather than demand. On 21 August, Grayscale's GSOL took $7.14 million of the $14.59 million that arrived, Bitwise's BSOL $6.57 million, and VanEck's VSOL $877,630 — so two products absorbed 94% of the day's flow and the third took the remainder. That concentration is normal for a young category, where the funds with the largest existing distribution relationships capture most of the money regardless of fee or structure. It also means the headline "Solana ETF inflows" figure is effectively a read on two issuers' sales channels rather than a broad measure of institutional appetite, which is a further reason to treat it as a sentiment signal rather than a demand curve.
Sentiment corroborates that framing. The Crypto Fear & Greed Index reached 72 on 21 August, its highest reading since July 2025 and firmly inside "greed" territory. A market that is simultaneously in greed conditions, rallying across every risk asset on the same sessions, and attracting fund flows equal to a fraction of a percent of spot turnover is a market being driven by positioning and sentiment, not by allocation. That is neither bullish nor bearish in itself — it is simply a different mechanism, and it decays on a different timetable.
There is a structural point underneath. Bitcoin's ETF complex reached a scale where it genuinely absorbs a meaningful share of new supply and float. Solana's has not, and the gap is not close. Until spot Solana ETF net assets are a double-digit percentage of market capitalisation rather than 1.7%, the token will keep trading on the same crypto-beta impulses it always has — which is exactly what 27 August looked like. The broader ETF picture across assets, tracked in our coverage of the AI complex that moved on the same day, points at a single macro driver rather than six separate stories.
Volatility, Beta and What the Numbers Imply
Solana's realised volatility is 59.1% annualised over 90 days and 55.2% over 30 days. For context, that is roughly nine times the 6.6% realised volatility of AUD/USD and materially above most large-cap equities. It is the reason a 13% day barely registers as unusual for this asset while the same move in a currency pair would be a generational event.
| Measure | Solana | Reference point, same day |
|---|---|---|
| 24-hour move | +13.04% | Bitcoin +3.17% |
| 30-day move | +46.93% | — |
| 12-month move | −47.41% | — |
| From 7 June low | +75.71% | — |
| Below January 2025 record | −62.7% | — |
| ETF net assets / market cap | ~1.7% | Cumulative inflow ≈ 4 hours of spot volume |
The implied beta is the number to carry away. Solana moved 4.1 times Bitcoin's percentage change on 27 August. If that relationship holds — and across this cycle it broadly has — then a 10% Bitcoin drawdown implies something in the region of a 40% Solana drawdown. The asset that gives you 46.9% in a good month is the same asset that gave you a 62.7% peak-to-trough decline from January 2025, and those are not separate characteristics. They are the same characteristic observed in different tape conditions.
The supply picture adds a mild headwind that rarely gets mentioned in rally coverage. Circulating supply is 584.06 million against a total of 632.97 million, so roughly 48.9 million tokens — about 7.7% of the total — remain outside circulation. At $109.27 that is approximately $5.3 billion of potential future float, or five times the entire ETF complex's net assets. Supply schedules do not move prices on any given day, but they set the level of persistent demand required simply to hold a price steady.
Firedancer and the Regulatory Backdrop
The genuine structural development on Solana is Firedancer, the independent validator client built by Jump Crypto, which is now running on mainnet with a deliberately gradual rollout while security audits and stability testing continue. Its significance is client diversity rather than raw throughput: a network running a single validator implementation carries correlated failure risk, and Solana's history of outages made that risk concrete. A second production-grade client materially reduces it.
That is a real engineering improvement with real long-term value, and it is also not a 13%-in-a-day catalyst. Infrastructure upgrades that reduce tail risk are priced slowly and diffusely, not in single sessions. Treating a gradual validator rollout as the explanation for a specific day's move is the same error as crediting the ETF: attaching a convenient narrative to a move that a correlated risk-on tape already explains.
On the regulatory side, the existence of spot Solana ETFs from Grayscale, Bitwise and VanEck means United States regulators have accepted the surveillance and custody arrangements for the underlying asset. That is a meaningful shift from the position of a few years ago, and it opens the door to the wealth-management and retirement channels that hold the genuinely large pools of capital. But acceptance is not adoption. The $1.06 billion currently sitting in those funds is the measure of how far adoption has actually travelled, and it is early.
What This Changes
The risk model, not the price target. The practical consequence of the ETF arithmetic is that Solana should be sized as a high-beta crypto position rather than as an institutionally-anchored one. The flows are not deep enough to dampen a drawdown, so position sizing should assume the historical beta of roughly four times Bitcoin holds through the next decline as it has through this advance.
The level that matters is $90.98, not $109. That was the 21 August close from which this 20.1% leg began. A retreat below it would mean the entire late-August acceleration had unwound, and would place the June-to-August recovery back into the slow-grind regime rather than the breakout regime. Above, the reference is the February 2026 congestion that produced the last sustained trading above $100.
RelatedKaspa Price Prediction for KAS: $0.055 Bull, $0.025 Bear
Watch spot volume, not ETF flow. At $6.88 billion a day, spot turnover is where Solana's price is actually determined. A rally on falling spot volume is a short-covering artefact; the same rally on rising volume is accumulation. Given that ETF activity is roughly 1.1% of spot, the fund flow numbers published each morning are close to noise for short-horizon purposes, however useful they are as a slow indicator of institutional acceptance.
What would change this reading: spot Solana ETF net assets crossing into double-digit percentages of market capitalisation, which would make flows genuinely price-relevant; or a decisive break in the Bitcoin correlation, which would suggest Solana had begun trading on its own fundamentals for the first time in this cycle. Neither is visible in the current data.
Frequently Asked Questions
Why did Solana jump 13% on 27 August 2026?
Principally as high-beta exposure to a market-wide risk-on session, in which Bitcoin rose 3.2% and equity risk assets also gained sharply. Solana moved roughly 4.1 times Bitcoin's percentage change, consistent with its behaviour through this cycle. ETF inflows were positive but far too small in scale to have mechanically driven a move of that size.
How much money is in Solana ETFs?
Total net assets across spot Solana ETFs were $1.06 billion as at 21 August 2026, with cumulative inflows since launch of $1.18 billion, according to SoSoValue. That is approximately 1.7% of Solana's market capitalisation, and the cumulative figure equates to roughly four hours of spot trading volume at current turnover.
Is Solana still down over the past year?
Yes, substantially. Despite gaining 46.9% over thirty days, SOL is down 47.4% over twelve months and remains 62.7% below its January 2025 record of $293.31. The 52-week range runs from $62.18 in June 2026 to $247.60 in September 2025, which is the honest measure of how much has been recovered.
What is Firedancer and does it affect the price?
Firedancer is an independent validator client for Solana developed by Jump Crypto, now running on mainnet with a gradual rollout. Its main benefit is client diversity, which reduces the correlated-failure risk behind Solana's historical outages. It is a genuine structural improvement, but infrastructure changes of this kind are priced slowly rather than in single sessions.
How volatile is Solana?
Realised volatility is 59.1% annualised over 90 days and 55.2% over 30 days — roughly nine times that of a major currency pair such as AUD/USD. That volatility is symmetrical: the same characteristic that produced a 46.9% month also produced a 62.7% decline from the January 2025 peak.
What level should traders watch on SOL?
$90.98, the 21 August close from which the current 20.1% advance began. A move back below it would unwind the late-August acceleration entirely. Spot volume is a more informative signal than daily ETF flow, since ETF trading is roughly 1.1% of spot turnover.
Analysis and information only; not investment advice. Cryptoassets are highly volatile and largely unregulated in many jurisdictions; you can lose your entire capital. Prices cited are as at 27 August 2026. Featured image: Wikimedia Foundation servers by Victorgrigas, CC BY-SA 3.0 via Wikimedia Commons.
