

At about 3:30 p.m. on Sunday 13 September, the lights went out at ExxonMobil's refinery in Channahon Township, southwest of Chicago. Power came back around 7 p.m., but by then the safety systems had already done their job: the plant tripped into a full shutdown and the flare stacks lit up over Interstate 55, CBS News Chicago reported. The Joliet refinery can run 275,000 barrels of crude a day and makes roughly 11 million gallons of gasoline and diesel daily, according to ExxonMobil's own 2026 fact sheet. Eight days later the U.S. Energy Information Administration's Monday survey put the national average for regular gasoline at $4.478 a gallon, up 15.9 cents in a week and the highest reading since 18 May. The Midwest led the move by a wide margin. That single dark plant in Will County now sits inside the national pump price, and the weekly data show exactly where.
Here is the part the headline number hides. Gasoline climbed in two consecutive weeks by almost the same amount, 16.2 cents and then 15.9 cents, but the two rises had different engines. In the first, crude did the work: the WTI spot price jumped from $92.69 on 4 September to $101.27 on 11 September, and the retail premium over a gallon's worth of crude actually narrowed. In the second, WTI barely moved (Friday 18 September settled at $101.44, just 17 cents above the prior Friday), yet the pump price still rose 15.9 cents. That second leg is refining, not oil. And it was concentrated: the Midwest's usual discount to the national average collapsed from 22.8 cents to 9.2 cents in a single survey.
- US regular gasoline averaged $4.478 a gallon on 21 September, up 15.9 cents on the week and 40.7 cents (10.0%) in three weeks — EIA via FRED GASREGW, 21 Sep 2026
- Midwest regular rose 29.5 cents in the same week to $4.386, the biggest regional gain in the EIA survey — EIA Midwest retail series, 21 Sep 2026
- Midwest (PADD 2) refinery utilization fell from 100.0% to 89.0% in the week to 18 September as crude runs dropped 439,000 barrels a day — EIA Weekly Petroleum Status Report, 23 Sep 2026
- Midwest gasoline stocks stood at 43.6 million barrels, 7.2% below a year earlier and the lowest for the third week of September in EIA weekly data back to 1990 — EIA WPSR Table 5, 23 Sep 2026
- Total US gasoline stocks fell 1.7 million barrels to 206.0 million, 4.9% below a year ago and the thinnest for the week since 2012 — EIA WPSR Table 4, 23 Sep 2026
- Joliet's 275,000 b/d equals 6% of Midwest refining capacity — ExxonMobil Joliet fact sheet, 2026
The 15.9 cents, taken apart by region
The EIA survey breaks the national average into regions, and the split is the story. Every region rose in the week to 21 September. Only one rose by more than 18 cents.
| EIA region (regular, $/gal) | 31 Aug | 14 Sep | 21 Sep | 1-week change | 3-week change | vs 22 Sep 2025 |
|---|---|---|---|---|---|---|
| United States | 4.071 | 4.319 | 4.478 | +15.9c | +40.7c | +130.5c |
| Midwest (PADD 2) | 3.847 | 4.091 | 4.386 | +29.5c | +53.9c | +137.8c |
| California | 5.520 | 5.827 | 6.003 | +17.6c | +48.3c | +153.5c |
| West Coast (PADD 5) | 5.206 | 5.467 | 5.600 | +13.3c | +39.4c | +132.8c |
| Gulf Coast (PADD 3) | 3.618 | 3.852 | 3.972 | +12.0c | +35.4c | +125.6c |
| East Coast (PADD 1) | 3.937 | 4.191 | 4.285 | +9.4c | +34.8c | +125.5c |
Source: U.S. Energy Information Administration weekly retail gasoline survey, regular all formulations, retrieved 24 September 2026 from FRED and the EIA gasoline and diesel page.
Look at the Gulf Coast and East Coast lines. Those regions face broadly the same crude price as the Midwest, and they rose 12.0 and 9.4 cents. That spread of outcomes is the cleanest way to strip the oil price out of the move. If this were a crude story, the regions would have moved together, the way the East Coast, Gulf Coast and Midwest did in the week to 14 September, when all three rose between 16 and 20 cents.
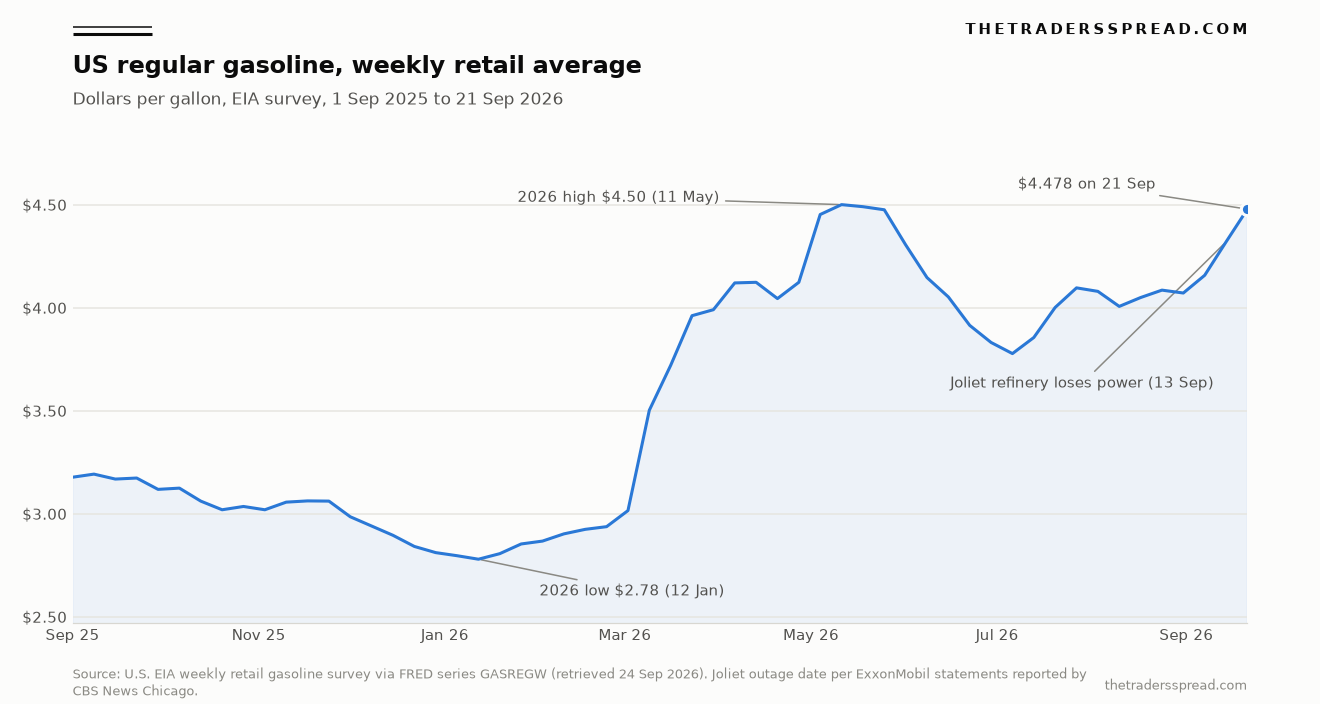
The chart puts the September run in context. Gasoline bottomed at $2.78 in mid-January, jumped past $4 in April, peaked at $4.50 on 11 May and slid back to $3.78 in early July. The latest leg has now retraced nearly all of that summer decline. One more week like the last two would set a new high for the year in the EIA series. AAA's daily survey, which runs on a different station sample, already had the national average at $4.43 on 17 September and called its own 2026 record $4.56, set on 21 May, according to the AAA newsroom release that day. The two surveys are not interchangeable, so this piece quotes the EIA figure for levels and uses AAA and GasBuddy only for their own numbers.
A simple way to see the refining effect is to subtract a gallon's worth of crude from the retail price. Crude is priced per 42-gallon barrel, so divide WTI by 42 and compare it with the pump.
| EIA survey date | US retail ($/gal) | WTI, prior Friday ($/bbl) | WTI per gallon | Retail minus crude |
|---|---|---|---|---|
| 31 Aug 2026 | 4.071 | 84.57 | 2.014 | 2.057 |
| 7 Sep 2026 | 4.157 | 92.69 | 2.207 | 1.950 |
| 14 Sep 2026 | 4.319 | 101.27 | 2.411 | 1.908 |
| 21 Sep 2026 | 4.478 | 101.44 | 2.415 | 2.063 |
Source: EIA retail survey via FRED GASREGW; WTI Cushing spot via FRED DCOILWTICO, both retrieved 24 September 2026. The retail-minus-crude gap includes taxes, distribution and retail margin, so read it for direction, not as a refining margin.
The gap shrank for two weeks while crude surged, which is what normally happens: pump prices lag oil on the way up. Then, in the week the Joliet refinery went dark, it widened by 15.5 cents with crude flat. That jump is the fingerprint of a regional supply problem being passed to the pump.
Why one refinery could move a national number
ExxonMobil describes Joliet as 6% of Midwest refining capacity. Patrick De Haan, head of petroleum analysis at GasBuddy, used a bigger figure when he spoke to CBS News Chicago the day after the outage. "That certainly is also very problematic for a refinery that contributes almost 10% of the supply in the region," he told CBS News Chicago. The two numbers measure different things (share of nameplate capacity versus share of fuel actually delivered into the region's pipelines), and the gap between them matters. A plant running flat out in a tight market carries more weight than its capacity share suggests.
The EIA's weekly data, released on 23 September for the week ending 18 September, show the size of the hole. Crude runs at Midwest refineries fell from 4.241 million barrels a day to 3.802 million. That drop of 439,000 barrels a day is larger than Joliet's entire 275,000 b/d nameplate, which fits with De Haan's note on Bluesky on 14 September that BP's Whiting, Indiana refinery was already partially down for maintenance. Utilization went from 100.0% to 89.0%. Nationally, the decline was milder, from 96.8% to 94.0%, because the Gulf Coast barely moved.
| Refining district (EIA) | Utilization, week to 11 Sep | Utilization, week to 18 Sep | Crude runs, 18 Sep (kb/d) | Total gasoline stocks, 18 Sep (mb) | Stocks vs year ago |
|---|---|---|---|---|---|
| Midwest (PADD 2) | 100.0% | 89.0% | 3,802 | 43.6 | -7.2% |
| East Coast (PADD 1) | 87.7% | 89.2% | 834 | 51.0 | -6.4% |
| Gulf Coast (PADD 3) | 96.9% | 96.5% | 9,496 | 77.7 | -0.8% |
| West Coast (PADD 5) | 94.9% | 94.5% | 2,058 | 27.3 | -9.1% |
| United States | 96.8% | 94.0% | 16,811 | 206.0 | -4.9% |
Source: EIA Weekly Petroleum Status Report, Table 9 and Table 5, released 23 September 2026.
What turned an outage into a price event was the starting point. Midwest gasoline stocks were 43.6 million barrels on 18 September. For the third week of September, that is the lowest level in the EIA's weekly series back to 1990, a hair below the 43.7 million of September 2022 and well under the 47.0 million held a year ago. The region went into the outage with less gasoline in its tanks than at the same point of any year since the weekly record began in 1990. A plant loss that a well-stocked market could absorb by drawing on inventory instead had to be met by price, because price is the tool that pulls barrels in from the Gulf Coast by pipeline.
Oddly, Midwest stocks only fell 476,000 barrels in the outage week. That is not a sign the outage was trivial. It tells you the market was already rationing through price and importing from elsewhere, which is exactly what a 29.5-cent regional jump does.
National inventories are not much more comfortable. At 206.0 million barrels, total US gasoline stocks are the lowest for this week of the year since 2012, when they stood at 195.8 million. Demand is not the culprit: EIA's measure of finished gasoline supplied was 8.85 million barrels a day in the week to 18 September, 1.3% below the 8.96 million of a year earlier. Refiners ran above 96% of capacity through the first half of September; the stock deficit is a supply-side story.
What Michigan saw, and what AAA and GasBuddy said
The pain was not evenly spread across the Midwest either. Michigan, which takes pipeline product from Joliet, took the sharpest hit. "Michigan drivers are seeing a significant increase at the pump, with gas prices climbing 62 cents in just one week and reaching their highest levels since July 2022," said Adrienne Woodland, spokesperson for AAA-The Auto Club Group, in a release dated 21 September. AAA put the Michigan average at $4.93 a gallon.
GasBuddy's weekly national figure came in at $4.44, up 18.5 cents. De Haan tied the regional pattern to the plants directly. "Average gasoline prices rose in virtually every state over the last week, with 45 states seeing increases of more than 3 cents per gallon, led by the Great Lakes region where refinery issues sent Michigan, Indiana, Illinois, Ohio, and Wisconsin all up more than 30 cents per gallon," he said, as reported by The Detroit News on 21 September. Diesel, he added, rose in every state, with GasBuddy's national diesel average at $6.490.
That diesel figure is a reminder that the Joliet outage hit both fuels. The diesel scenarios we set out on 7 September were built on a global distillate squeeze; the Midwest outage layered a local shock on top. Gasoline has a seasonal release valve that diesel lacks, which is covered below.
The case that this fades fast
Three facts argue that the 15.9 cents is a spike, not a new floor.
First, crude has already turned. WTI spot fell from $107.02 on 15 September to $96.41 on 22 September, a 9.9% drop in a week, per FRED. The EIA survey of 21 September captured almost none of that, because pump prices trail wholesale moves by a week or more. At $96, the crude inside a gallon costs about 25 cents less than at the 15 September peak, and about 12 cents less than on 18 September. The background to that crude swing, from the Iran strikes onward, is in our WTI piece from 3 September and the Brent scenarios of 11 September.
Second, the refinery is coming back. Reuters reported on 21 September that restart of Joliet units was in progress a week after the outage. ExxonMobil has not published a date for normal operations, and restarts often run in stages, with crude units first and gasoline-making units later. The EIA data due on 30 September, for the week to 25 September, will show whether Midwest runs have recovered toward the mid-90s.
Third, the calendar helps. After 15 September, retailers can switch to cheaper winter-grade gasoline with a higher vapor pressure. De Haan flagged on 14 September that "some pressure will ease with change to winter gasoline." That switch was already under way during the 21 September survey, which makes the rise that week look even more like a supply shock.
On the other side of the ledger sits the stock position. Restarting a refinery refills pipelines before it refills tanks. With Midwest inventories at a record low for the season and national stocks at a 14-year seasonal low, any second outage (a Whiting delay, a pipeline problem, a storm) would meet the same thin cushion. There is also the retail lag, which cuts both ways: stations were still catching up to wholesale costs on 21 September, so the 28 September survey could show a smaller rise even as spot gasoline eases.
RelatedEU Carbon Price Rises to €82.32 on the Q3 CBAM Print
What this changes
For anyone reading the weekly energy data, the useful shift is in what drives the pump over the next month. Through early September the national price tracked crude closely, and a trader could read gasoline off a WTI screen. Since 13 September it has been a refinery and inventory story, concentrated in one region, and the crude screen has been pointing the other way. Those two forces now pull against each other: crude is down roughly 10% from its mid-month peak, while the Midwest's supply buffer is the thinnest in the record.
The base case, which we put at about 55%, is that Joliet's restart and the lower crude price reverse most of the Midwest's 29.5-cent jump within two to three EIA surveys, with the national average easing behind it. The upside case, around 25%, is a slow or staged restart that keeps Midwest refinery use below 95% into October; in that world the EIA survey sets a new high for 2026. The downside case, about 20%, is that crude keeps falling and the restart is clean, which could return the national average to where it stood in early September, before the Joliet outage.
These are scenarios for the survey, not a price call on any futures contract.
What would change my mind: a Midwest utilization print above 95% on 30 September alongside a Midwest stock build would say the shock is over, and the base case moves up. A second consecutive week with Midwest runs below 90%, or a fresh draw that takes PADD 2 stocks under 43 million barrels, would say the region is still short, and the upside case becomes the more likely one. The next reads are the EIA retail survey on Monday 28 September and the weekly supply report on Wednesday 30 September. The EIA stopped publishing its highlights PDF on 23 September, so the tables on the WPSR page are now the place to check.
FAQ
How much did US gasoline rise in the week to 21 September 2026?
The EIA's weekly survey put regular gasoline at $4.478 a gallon on 21 September, up 15.9 cents from $4.319 on 14 September. Over three weeks the rise was 40.7 cents, or 10.0%, from $4.071 on 31 August. It was the highest EIA reading since 18 May, when the average stood at $4.49.
Why did Midwest gas prices jump more than the rest of the country?
ExxonMobil's 275,000 b/d Joliet refinery lost power on 13 September and shut down. EIA data show Midwest refinery utilization fell from 100.0% to 89.0% in the week to 18 September, while Midwest gasoline stocks sat at 43.6 million barrels, the lowest for that week since 1990. Midwest pump prices rose 29.5 cents, against 9.4 cents on the East Coast.
Is the Joliet refinery back online?
Reuters reported on 21 September that restart of units at the plant was in progress. ExxonMobil has not given a public date for normal operations. The clearest independent check is the EIA's weekly Midwest refinery utilization figure, published each Wednesday; the 30 September release covers the week to 25 September.
Why did gas prices rise when oil prices were falling?
Pump prices lag wholesale moves, and the 21 September survey reflected costs from the prior week, when WTI was still above $100. The rise that week also came with crude flat Friday to Friday, which points to the refinery outage and low inventories rather than oil. WTI's later fall to $96.41 on 22 September had not yet reached the pump.
What is the difference between the EIA, AAA and GasBuddy averages?
Each uses a different station sample and timing. EIA surveys stations each Monday and publishes regional series back decades. AAA publishes a daily national average and put it at $4.43 on 17 September. GasBuddy compiles millions of user price reports and had $4.44 on 21 September. Compare each survey with itself over time, not across providers.
Disclaimer: This article is analysis and information only, not investment advice or a recommendation to trade any instrument. Commodity and derivatives trading carries a high risk of loss, and you can lose more than your initial capital. Figures are drawn from the named sources on the dates shown and may be revised.