

Having watched diesel through the 2008 spike, the 2020 collapse and the 2022 squeeze, I have learned to distrust the headline gallon price and read the second line instead. Diesel is not a price. It is a spread with a barrel attached, and the two halves move for entirely different reasons, which is why a desk that treats it as a proxy for crude gets the direction right for the wrong reason and then gets the size wrong. On 1 September 2026 the EIA printed New York Harbor ultra-low-sulphur diesel at $4.724 per gallon, the highest daily spot in that series since 10 November 2022. Diesel is quoted in dollars per gallon at the harbour, which flatters it; multiply by 42 and the same barrel is $198.41. Cushing WTI closed the same session at $91.48. Subtract, and the distillate crack was $106.93 per barrel. That second line, not the first, is what a diesel forecast has to solve.
That number is the entire story, and it is not a crude story. Since EIA's NYH series began in June 2006 there have been 5,070 daily observations. Thirty-three of them have printed a crack above $100: twenty-six in 2022, seven this year. The 1 September print ranks nineteenth of 5,070. Meanwhile the crude side has been loosening underneath it. Commercial US crude stocks excluding the Strategic Petroleum Reserve rose from 404.5 million barrels in the week to 24 July to 424.5 million in the week to 28 August, a build of nearly 20 million barrels while diesel was setting four-year highs. Refiners are not short of oil. They are short of the capacity to turn it into the right molecule, and that is a constraint you cannot import your way out of in eight weeks.
Key facts
- NY Harbor ULSD spot $4.724/gal on 1 September 2026, up 119.7% from $2.15 on 5 January and 95.2% year on year — EIA daily spot series EER_EPD2DXL0_PF4_Y35NY_DPG, retrieved 7 September 2026.
- Distillate crack against WTI $106.93/bbl, versus $35.69 on 2 September 2025 — a threefold widening in twelve months (EIA, author's calculation, 7 September 2026).
- US distillate stocks 104.187 million barrels in the week to 28 August, 10.1% below the same week of 2025 and 13.9% below the five-year comparable-week average of 121.0 million — EIA Weekly Petroleum Status Report, 28 August 2026.
- East Coast (PADD 1) distillate stocks 19.318 million barrels, down 32.8% from 28.734 million a year earlier — EIA, week to 28 August 2026.
- Refinery utilisation 98.0%, the highest weekly print of 2026, against an August 2025 average of 95.8% — EIA, week to 28 August 2026.
- Distillate yield 29.0% of gross refinery inputs, down from 30.9% in the week to 17 July, even as gross inputs hit a 2026 high of 17.661 million b/d — EIA, 28 August 2026.
- Retail on-highway diesel $5.599/gal in the week to 31 August, from $4.796 on 13 July — EIA weekly retail series.
The barrel is fine. The conversion is not.
Our news desk covered the crude leg of this move when WTI climbed 21% to $91 as US strikes on Iran resumed. That piece is about the barrel. This one is about what happens to the barrel after it reaches the gate, and the two prices have diverged violently. WTI is up 57.5% year to date, from $58.10 on 5 January. NYH diesel is up 119.7% over the same window. Roughly two-thirds of what a US trucking fleet is now paying for wholesale diesel above January levels came from the refining margin, not from crude.
Jefferies analyst Sam Burwell put it plainly in a note on 13 August: "What this all shows is that global oil-market tightness is manifesting itself in cracks, not crude, at least for now."
The mechanism runs through three chokepoints rather than one. Persian Gulf refined-product flows have fallen further than crude flows: Kpler data cited on 13 August put Gulf diesel exports down 80% year on year against 48% for crude, so importing regions must source distillate from further away at higher freight cost. Russian refining capacity remains impaired. And the US refining system, which would normally arbitrage that away, is already running as hard as it physically can.
What 98% utilisation actually buys you
This is the part the crude narrative misses, and it is measurable in EIA's own weekly tables rather than inferred.
In the week to 28 August, US refiners ran 17.661 million barrels a day of gross inputs at 98.0% of operable capacity, both 2026 highs. Distillate production that week was 5.126 million b/d. In the week to 17 July, gross inputs were 17.319 million b/d and distillate production was 5.349 million b/d. Refiners processed 342,000 more barrels a day of feedstock and produced 223,000 fewer barrels a day of distillate. The distillate yield fell from 30.9% to 29.0%. On a four-week average basis it fell from 30.5% in the period to 31 July to 29.6% in the period to 28 August, while the gasoline yield barely moved, 55.8% to 55.5%.
Read that again against a $107 crack. The margin signal to make diesel has never been louder, and the system made proportionally less of it.
Compare year on year and the picture hardens. August 2026 distillate production averaged 5.192 million b/d. August 2025 averaged 5.208 million b/d. Utilisation was 2.2 percentage points higher this year and the distillate barrels were fractionally fewer. Distillation capacity is not the binding constraint; hydrotreating, hydrocracking and crude slate are. Valero's Executive Vice President and Chief Operating Officer Gary K. Simmons described the same wall on the company's Q2 call on 30 July: "Refinery crack spreads are now really being set by hydroskimming margins in Northwest Europe... inflationary pressures will result in a higher floor on refinery cracks." On the same call he sized the global hole at "about 130 million barrels below where they would normally be at this time of year" for light-product inventories.
Inventories, and the 28.5-day number
Headline distillate stocks of 104.187 million barrels understate the problem in one direction and overstate it in another, so both corrections are worth making.
The understatement is regional. East Coast distillate, which is the heating-oil barrel and the barrel that clears through New York Harbor, sits at 19.318 million barrels against 28.734 million a year ago. That is a third of the regional cover gone. Gulf Coast stocks at 42.666 million are down only 3.0% year on year. The national average hides a genuinely dislocated PADD 1 heading into the heating season.
The overstatement is demand. Days of supply is the honest metric, and it is less alarming than the raw draw. Four-week average distillate product supplied is 3.660 million b/d, which puts cover at 28.5 days. A year ago, 115.923 million barrels against 3.859 million b/d of demand was 30.0 days. The cover has thinned by a day and a half, not by a week, because price has already rationed some consumption. Product supplied in the week to 28 August fell to 3.390 million b/d, 7.4% below the four-week average.
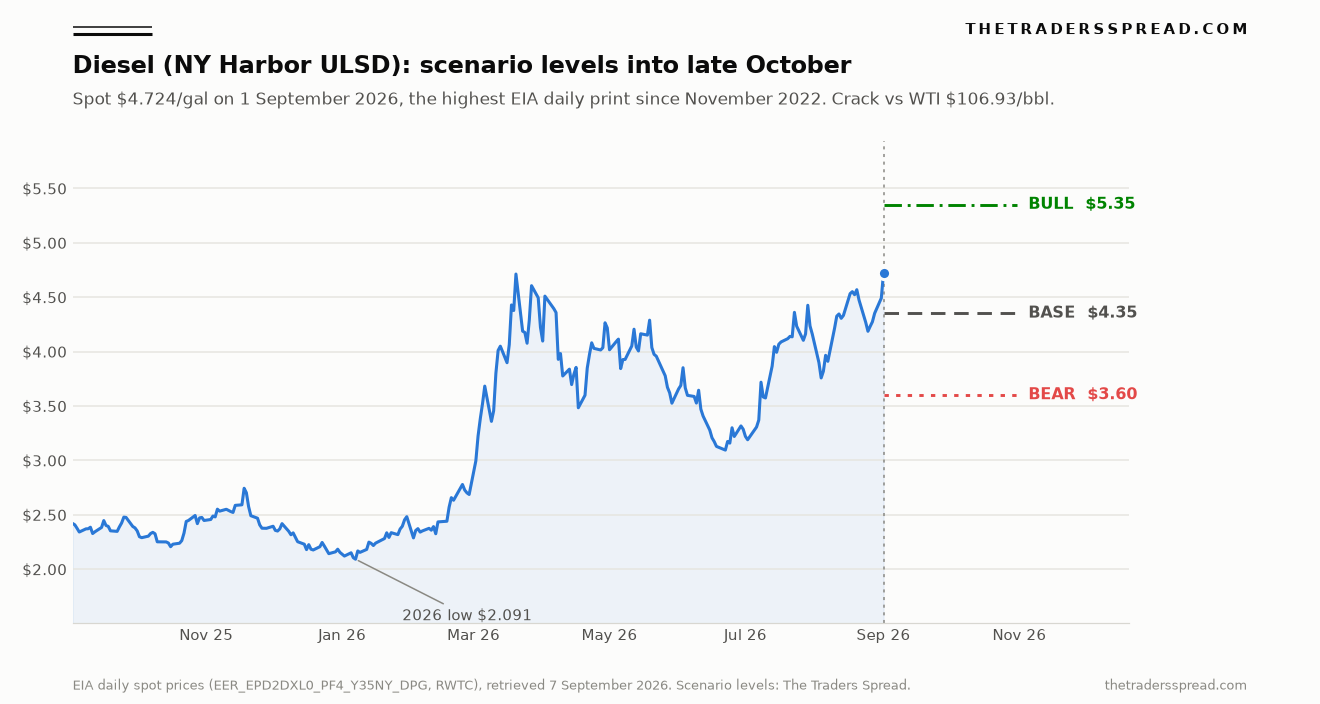
The arithmetic behind each scenario
| Scenario | ULSD $/gal | Implied $/bbl | WTI assumption | Implied crack |
|---|---|---|---|---|
| Spot, 1 Sep 2026 | $4.724 | $198.41 | $91.48 | $106.93 |
| Bull | $5.35 | $224.70 | $105 | $119.70 |
| Base | $4.35 | $182.70 | $90 | $92.70 |
| Bear | $3.60 | $151.20 | $85 | $66.20 |
| All-time high, 11 May 2022 | $5.339 | $224.24 | $105.50 | $118.74 |
The table is the discipline. A $5.35 print is not a crack story or a crude story on its own; it needs both legs to move together, and it lands a hair above the May 2022 record on each. Anyone quoting a diesel target without stating the crude assumption behind it is quoting half a number.
The precedent that rhymes, and where it stops rhyming
On 11 May 2022 the NYH crack hit $118.74, the widest in the series. Diesel printed $5.339, still the record. One week later the crack was $75.0. Two weeks later it was $57.8 and diesel was $4.064, down 23.9% from the high. Nothing about the physical market had been fixed in ten sessions. The spread simply became too expensive for the marginal buyer to pay, blending economics changed, cargoes turned around mid-ocean, and the paper length that had crowded the trade left at once.
US distillate stocks bottomed that cycle at 104.029 million barrels in the week to 6 May 2022. Today's 104.187 million is 158,000 barrels above it. The two lows are, for practical purposes, the same number.
Here is where the analogy breaks, and it breaks in the bulls' favour. May is the seasonal trough of the distillate draw with a summer rebuild ahead of it. Late August is the top of the shoulder, with October through March of heating demand still to come, and with autumn turnaround season about to take utilisation down from 98%. In 2022 the market was staring at four months of rebuilding. In 2026 it is staring at four months of drawing from a starting point that is already at the 2022 low.
Who is on which side
The sell side has split cleanly, which is useful, because the two camps disagree about the same fact rather than about different ones.
Bank of America's Head of Commodities Francisco Blanch told clients in a note titled "Diesel's Perfect Summer Storm" that the fuel is "materially disrupted in 3 of 4 major regions" and that, "absent a meaningful supply recovery, the diesel market appears poised to stay tight, volatile, and expensive well into next year." Citi's Anthony Yuen, Managing Director and Head of Energy Strategy, has global observed diesel inventories "below the five-year minimum". Goldman Sachs commodities researcher Daan Struyven frames the Hormuz shock as more disruptive for refined products than for crude, but adds the sentence the bulls skip: "Near-record prompt diesel margins have already triggered a strong supply response."
The official forecast sits further out still. EIA's Short-Term Energy Outlook of 11 August 2026 carries a wholesale diesel average of $3.37/gal for 2026 and $2.62/gal for 2027, which embeds a complete normalisation of the crack. The September edition lands on 9 September and is the single most consequential scheduled datapoint for this trade, because a large upward revision would mark the moment the official view capitulated to the physical market.
The disconfirmation case
Three things in the data argue against paying up here, and I would rather write them down than discover them later.
The draw has already stalled. Distillate stocks rose 796,000 barrels in the week to 28 August after three consecutive weekly declines. One build is not a trend, but at a $107 crack it is the response you would expect the incentive to produce, and it arrived on schedule.
The crude leg is loose. Twenty million barrels of commercial crude built in five weeks while the SPR ran down to 286.6 million barrels, 29.2% below a year ago. If the geopolitical premium in crude deflates, diesel loses the WTI half of $198 without any change in refining at all. Our prediction markets desk has argued that Polymarket's 23.5% blockade odds look too high; that view, if right, is bearish diesel through the crude leg.
And the demand side is already answering. Product supplied at 3.390 million b/d in the latest week is the kind of print that shows up before an inventory turn, not after it. Freight, farming and construction all substitute or defer at these levels, and the energy complex has form here — the same rationing logic runs through our natural gas price prediction and the industrial-demand argument in our copper price prediction.
RelatedTungsten Price Prediction: 550,000 Yuan Bull vs 420,000 Bear
The call
Base case, 45% probability: $4.35/gal by late October. The crack retraces from $106.93 to the low $90s while WTI holds near $90. That is still 2.6 times the September 2025 crack and would leave diesel roughly double its January level. This case assumes the turnaround season is survivable, that the East Coast pulls in European cargoes at the current freight-adjusted arbitrage, and that no new disruption lands. It is the arithmetic of a market that is genuinely tight but has stopped getting tighter.
Bull case, 25% probability: $5.35/gal. This needs WTI near $105 and the crack retesting $119, at the same time. Practically that means a Hormuz interruption of more than a few days, or an early cold snap into a PADD 1 stock level a third below last year, or an unplanned outage at a US Gulf Coast hydrocracker during turnaround season. The level clears the 11 May 2022 record of $5.339 by a cent. I do not think a record is the modal outcome, but with cover at 28.5 days it is no longer a tail.
Bear case, 30% probability: $3.60/gal. A repeat of the May 2022 unwind, which took 23.9% out of NYH diesel in ten sessions from a similar crack and a similar inventory level. The trigger is usually not a supply fix. It is the marginal buyer refusing the spread, imports landing, and length liquidating into a market with no bid below it.
What would change my mind. A weekly distillate build above two million barrels, or a distillate yield back above 30.5%, would kill the base case toward the bear. A close above $4.95, a level printed on only eleven days in the twenty-year series and none since 17 May 2022, would say the market is pricing physical unavailability rather than a wide margin, and I would move the bull weighting up and the base down. A revision in the 9 September STEO taking the 2027 wholesale diesel forecast above $3.20/gal would tell me the official view has stopped expecting normalisation.
FAQ
Why is diesel quoted in dollars per gallon when crude is quoted per barrel?
The US wholesale convention for refined products is cents or dollars per gallon at the pricing hub, because that is how product is invoiced downstream. Crude is priced per 42-gallon barrel. To compare them you multiply the gallon price by 42. NYH ULSD at $4.724/gal is $198.41/bbl, which against $91.48 WTI gives the $106.93 crack. Any diesel forecast that does not state its crude assumption is incomplete, because roughly 46% of the current barrel price is the crude and 54% is the margin.
What exactly is the distillate crack spread?
It is the gross refining margin on turning a barrel of crude into diesel: the product price in barrel terms minus the crude price. It is a proxy rather than a true profit measure, because it ignores natural gas and hydrogen costs, the value of co-products, and the fact that no refinery makes only diesel. Traders use the 3-2-1 crack for a full refinery and the single distillate crack for the diesel-specific signal. At $106.93 the diesel crack is roughly four times a normal cycle level.
Are US distillate inventories actually at a record low?
No, and the claim should be resisted. At 104.187 million barrels in the week to 28 August 2026, stocks are the lowest for that calendar week in decades and 13.9% below the five-year comparable-week average, but the lowest weekly print this century was 92.840 million barrels in April 2000. The more useful framing is cover: 28.5 days of supply against 30.0 a year ago.
Does a high crack spread mean refiners will simply make more diesel?
Over a long horizon, yes. Over eight weeks, the evidence says no. US distillate yield fell from 30.9% to 29.0% between mid-July and late August while the crack widened, because at 98% utilisation the constraint is conversion and treating capacity and the available crude slate, none of which respond to a price signal within a quarter. Autumn turnarounds reduce capacity further before any of it can be added.
How does the diesel move relate to the crude rally?
They are separable and should be tracked separately. WTI is up 57.5% year to date; NYH diesel is up 119.7%. Commercial crude stocks built almost 20 million barrels between late July and late August while distillate stocks fell. A resolution of the crude risk premium would cut the diesel price through the WTI leg without repairing the refining shortage, which is why the crack is the variable to watch rather than the headline gallon price.
What is the single number to watch each week?
The distillate yield in EIA's Weekly Petroleum Status Report, published Wednesdays. It is distillate production divided by gross refinery inputs, and it tells you whether the record margin is finally pulling barrels into diesel. A sustained move back above 30.5% would be the earliest hard evidence that the squeeze is resolving.
Analysis, not investment advice. Levels and probabilities on this page are The Traders Spread's own estimates and may be wrong. Commodity and derivative markets are volatile and your capital is at risk. All prices and inventory figures are from the US Energy Information Administration and were retrieved on 7 September 2026; the most recent EIA daily spot observation at the time of writing was for 1 September 2026.