

On the afternoon of Tuesday 14 July 2026, the London Metal Exchange's daily warehouse report showed lead stocks up by 80,700 tonnes in a single session, almost all of it landing in Singapore. The next day's report added another 86,500 tonnes. By the settlement of 15 July, LME lead inventory stood at 456,575 tonnes, the cash price had printed $1,797 a tonne, and the metal that goes into nearly every car battery on the planet was sitting at its lowest price in more than a year. Bloomberg, in a report syndicated by MINING.COM on 14 July, attributed the first day's delivery to Trafigura, citing people familiar with the matter, and called it the biggest one-day increase in data going back to 1970. Eleven weeks on, lead cash settled at $1,886 on 28 September and the pile has shrunk to 358,700 tonnes. This article sets out where the lead price could sit by 31 March 2027, with a bull case of $2,100 and a bear case of $1,720.
The tempting reading of those eleven weeks is that the surplus is being consumed. The data does not support it. A fifth of the visible stockpile has left LME sheds since mid-July, yet the International Lead and Zinc Study Group's own count shows refined lead usage fell 0.6% in the first half, and the cash-to-three-month spread has been in contango at every settlement since 12 June. Physical buyers who were short of metal would have pushed nearby prices above forward ones. They have not. What has actually absorbed the world's excess lead this year is not a battery boom and not an EV bust. It is China, which swung from roughly balanced trade to 190,000 tonnes of net refined imports in six months. That flow, not the LME stock line, is the variable this forecast hangs on.
Key facts
- LME lead cash settled at $1,886.00/t and three-month at $1,911.50/t on 28 September 2026, a $25.50 contango. westmetall LME Pb cash table, retrieved 29 September 2026
- The 52-week cash range runs from $1,797.00 (15 July 2026) to $2,058.50 (13 November 2025); spot is 4.95% above the low and 8.4% below the high. westmetall, same retrieval
- LME lead stock fell 97,875 t, or 21.4%, from the 456,575 t peak of 15 July to 358,700 t on 28 September, yet remains 63.9% above the 218,825 t of 29 September 2025. westmetall, same retrieval
- World refined lead supply exceeded demand by 49,000 t in January to June 2026, with usage down 0.6% to 6.797 million tonnes. ILZSG press release, 26 August 2026
- China's net imports of refined lead reached 190,000 t in the first half of 2026, up 181,000 t on the same period of 2025. ILZSG, 26 August 2026
- The ILZSG's spring forecast put the 2026 refined lead surplus at 109,000 t, with demand up 1.1% to 13.72 million tonnes. ILZSG press release, 23 April 2026
- Batteries account for 80% of lead end use. ILZSG, "What is lead", retrieved 29 September 2026
What went into Singapore, and why it was not about demand
Start with the mechanics. LME stock is not a census of unsold metal. It is metal that somebody has chosen to put on exchange warrant, in an approved shed, paying rent. When the rent arrangement is attractive enough, metal goes in regardless of whether end users want it. When it stops being attractive, metal comes out, again regardless of end users.
LME Insight's weekly review for the week to 17 July described the inflow bluntly. It said 171,175 tonnes was warranted in Singapore over two days, "reportedly largely Indian-brand metal", and that it "reflected the warehouse rental and financing trade that has increasingly migrated from aluminium into lead." The same note observed that a $43.50 cash-to-three-month contango and more than 450,000 tonnes of visible stock left "little evidence of genuine nearby tightness." Bloomberg's report added that Singapore held more than 90% of all LME lead stock and that Trafigura had bought a local warehousing business the previous year.
Our coverage of aluminium's 12.9% rise as its LME stocks halved showed the same trade in reverse. Lead is now its host metal.
That matters for the forecast in a specific way. The 97,875-tonne draw since 15 July looks bullish on a chart, but the question is where the metal went. There are three possibilities: to consumers, to off-warrant storage in the same city, or to China. The first would show up as firmer nearby spreads and higher physical premiums; it has not. The second leaves the metal one paperwork step from returning. The third is real absorption, and it is the only one of the three that would sustain a rally.
The late-September picture is mixed. LME Insight's review of the week to 25 September counted available warrants at 328,000 tonnes, down 19,075 tonnes, with cancelled tonnage up 7,975 tonnes to 34,525. Cancelled warrants are metal flagged for withdrawal. At 34,525 tonnes they are under a tenth of the total, which is a long way from the kind of queue that squeezes a market.
The same note carried one detail worth pausing on. Citing Shanghai Metals Market, it reported that holiday stocking had pushed surveyed Chinese primary lead smelter inventories down to 800 tonnes, the lowest since April 2024, while SMM's battery-market review "described little change in end-use consumption and a sharp slowdown in spot lead trading once stocking was complete." Low smelter stocks with flat end use is a pre-holiday restock, not a demand shift. China's Golden Week begins on 1 October.
Testing the battery story against the consumption data
Two opposite myths circulate about lead. One says electric vehicles are killing it. The other says the "battery boom" must lift every battery metal, lead included. Both can be checked against ILZSG usage figures, and neither survives.
Global refined lead usage was 13.323 million tonnes in 2021 and 13.615 million tonnes in 2025, according to the table in the ILZSG's August release. That is a 2.2% rise over four years in which EV sales multiplied. It is also, plainly, not a boom.
The reason both myths fail is the shape of demand. Batteries take 80% of lead, and the dominant battery is the 12-volt starting, lighting and ignition unit, most of which is sold as a replacement into an ageing car fleet rather than fitted to new vehicles. An EV does not use lead for propulsion, but it still carries a 12-volt auxiliary battery, which is frequently lead-acid. Replacement demand tracks the size and age of the fleet on the road, which moves slowly in both directions.
The Battery Council International's May 2026 market report with CRU forecast North American lead battery sales rising 1.9% in 2026 after contracting 2.1% in 2025. Presenting it at the BCI convention in Nashville, Matt Jensen, Director of Consumer and Category Insights at Clarios, said: "The automotive market represents two-thirds of the entire [lead battery] market." On the EV question he was more pointed: "In the last 12 months, there's been a big shift by powertrain. If you look out to 2030, we see a drastic reduction in EVs." That is a battery maker talking about its own market, but the replacement arithmetic does not depend on his EV forecast being right. The same report cited S&P Global Mobility's figure of an average US car age of 12.8 years in 2025.
A year earlier, in the BCI's September 2025 release, Rebecca Conway, Vice President of US/Canada Marketing at Clarios, said: "Lead automotive batteries are expected to see consistent demand and modest growth in the years ahead, particularly in replacement applications."
Consistent and modest. For a price forecast that is the operative phrase: demand is not the swing factor. Supply is. And lead's supply is unusual among base metals because most of it is recycled. World mine output was 4.537 million tonnes in 2025 against refined production of 13.693 million tonnes, so mined lead is equivalent to about a third of refined output. The rest comes mainly from scrapped batteries, which flow to smelters on a schedule set by the fleet, not by the LME price. When prices fall, secondary smelters squeeze margins rather than stop. That is why lead surpluses tend to be persistent and shallow rather than violent.
The numbers behind the levels
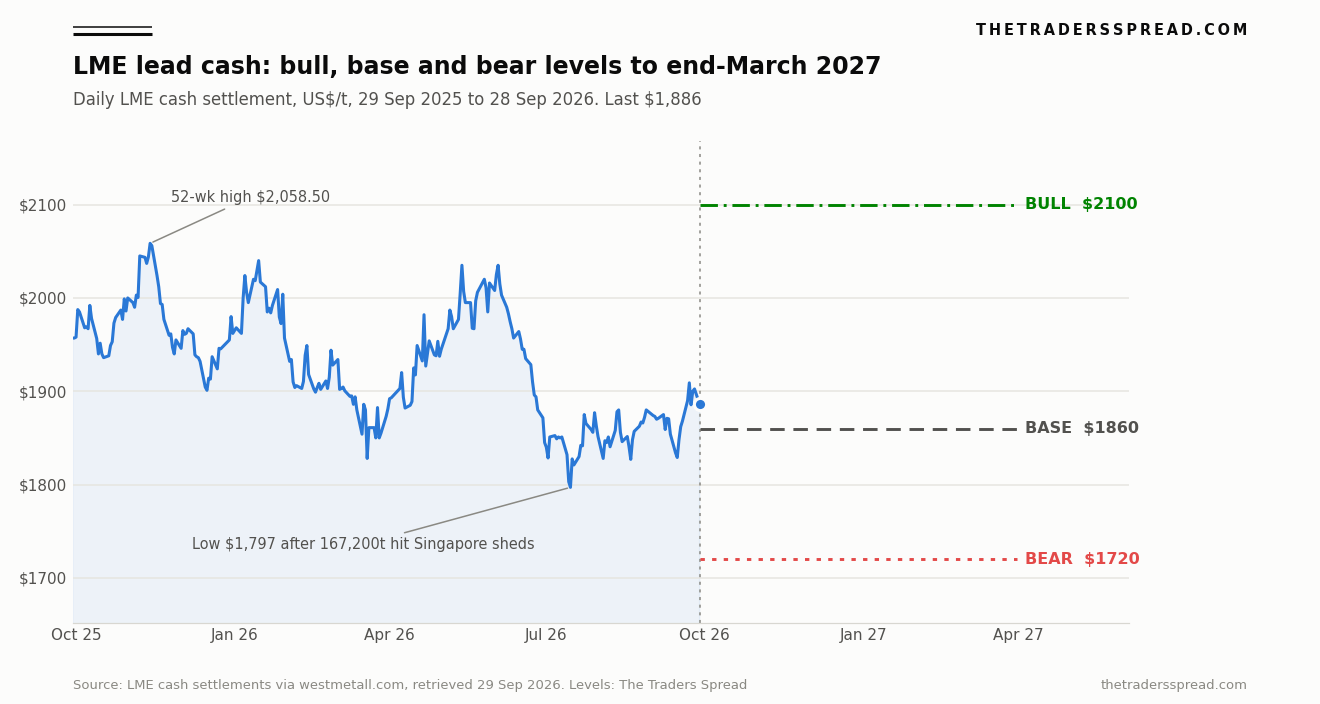
Every price in this article is an LME official cash settlement. That choice matters. A "52-week range" pulled from a continuous futures series usually mixes contract months, so its extremes can be roll artefacts or thin prints in an expiring contract. LME cash is different: it is the settlement for the same prompt tenor every day, so each point on the chart is directly comparable with every other. The high of $2,058.50 on 13 November 2025 and the low of $1,797.00 on 15 July 2026 sit on an identical basis.
Realised volatility is low. Annualised from daily log changes over the last 253 settlements, lead has moved at 13.8%, and at 11.9% over the most recent 60. Scaled to the roughly 125 trading days to 31 March 2027, a one-standard-deviation move is about 9.7%, or around $183 either side of spot. Both scenario levels sit near that boundary: $2,100 is 11.35% above $1,886 and $1,720 is 8.80% below it.
| Settlement date | Cash ($/t) | 3-month ($/t) | 3M minus cash | LME stock (t) |
|---|---|---|---|---|
| 29 Sep 2025 | 1,957.00 | 1,999.00 | +42.00 | 218,825 |
| 13 Nov 2025 (52-week high) | 2,058.50 | 2,087.00 | +28.50 | 223,975 |
| 2 Jan 2026 | 1,968.00 | 2,008.00 | +40.00 | 239,325 |
| 13 May 2026 (backwardation) | 2,035.00 | 2,005.00 | -30.00 | 265,300 |
| 13 Jul 2026 | 1,832.00 | 1,875.00 | +43.00 | 289,375 |
| 15 Jul 2026 (52-week low) | 1,797.00 | 1,843.00 | +46.00 | 456,575 |
| 1 Sep 2026 | 1,874.00 | 1,908.00 | +34.00 | 404,675 |
| 28 Sep 2026 | 1,886.00 | 1,911.50 | +25.50 | 358,700 |
Source: LME settlements via westmetall.com, retrieved 29 September 2026. Spread and percentage calculations are ours.
Read down the right-hand columns and the year's one genuine squeeze stands out. On 13 May 2026 cash settled $30 above three-month metal while LME stock was 265,300 tonnes, and the cash price touched $2,035. Brief backwardations recurred until 12 June, the last settlement without a contango. By the end of June the carry was back above $35. Measured from 2 January, lead cash is down 4.17%; over twelve months it is down 3.63%, while LME stock is up 63.9%. That is a metal where a two-thirds increase in visible inventory cost the price less than 4%, which says the market had already priced most of the surplus before the Singapore deliveries arrived.
The contango has narrowed, though. It was $46 on 15 July and $25.50 on 28 September. A narrowing carry is the first thing that would change if the draw were turning into real tightness, and it is moving in that direction, slowly.
China, the swing buyer nobody priced
In the ILZSG's first-half data, the most consequential line is one most coverage skipped. Chinese net imports of refined lead were 190,000 tonnes in January to June 2026, compared with about 9,000 tonnes a year earlier. That is roughly four times the entire global first-half surplus of 49,000 tonnes, from a country that also exports large volumes of finished lead-acid batteries.
Some refined lead and alloy smelters in China cut or halted output in July as secondary smelters faced rising costs, Batteries International reported. The ILZSG table confirms lower Chinese metal production in the half. Put those together and the picture is a Chinese supply gap filled from abroad, some of it plausibly from the same Indian-brand units that were being warranted in Singapore.
Here is the causal chain the forecast depends on. If Chinese secondary output stays constrained through the fourth quarter, the import window stays open, Singapore metal keeps leaving, and the surplus the ILZSG projected never shows up on the LME. If Chinese smelters restart as margins recover, imports fade, and the metal that has been quietly draining from Singapore stops draining. Our zinc report from 18 September showed how quickly a sister market's spreads can loosen once Chinese buying slows; lead shares the same mines and many of the same smelters.
There is a second tension inside the ILZSG numbers. The group's April forecast called for 2026 demand growth of 1.1% to 13.72 million tonnes. The first half delivered a 0.6% decline. To reach the forecast, second-half usage would have to be around 6.923 million tonnes, 2.1% above the second half of 2025. Supply needs only 1.5% growth in the half to hit the ILZSG's 13.83 million tonnes. Unless the autumn revision raises demand, the implied second-half surplus is about 61,000 tonnes, larger than the first half's. Monthly usage in the release fell from 1.174 million tonnes in April to 1.114 million in June, the weakest month in the table.
The group's 71st Session meets in Lisbon on 14 to 16 October 2026, where updated 2026 forecasts will be presented. That is the next hard catalyst on the calendar.
RelatedSoybean Meal Price Prediction: $410 Bull Case vs $310 Bear
The call: base, bull and bear to 31 March 2027
Base case, $1,860 (55%). Lead spends the next six months in a $1,800 to $1,960 band and settles near $1,860 at the end of March, 1.4% below spot. The ILZSG trims its 2026 demand growth in October and confirms a surplus for 2027. Singapore stocks keep drifting lower but the contango does not close, because Chinese imports slow after Golden Week restocking. Replacement battery demand holds up in the northern-hemisphere winter, when cold weather kills weak batteries, which is what keeps the floor above the July low.
Bull case, $2,100 (18%). A new 52-week high, 11.35% above spot. It needs cancelled warrants to climb above a quarter of LME stock, the cash-to-three-month spread to flip into sustained backwardation, and China to keep importing at the first-half pace. An ILZSG revision that cuts the 2026 surplus to near zero would be the trigger. Tin showed this year how far a thin physical market can run, as our tin price prediction set out, but lead has neither tin's supply concentration nor its tight stocks.
Bear case, $1,720 (27%). A break below the $1,797 July low, 8.80% under spot. The route runs through a second wave of rent-deal deliveries into Singapore, Chinese secondary smelters restarting and closing the import window, and an ILZSG surplus forecast above 150,000 tonnes. A single-day stock build of 50,000 tonnes or more would be the tell, since the July print showed how the price responds to that.
Taken together, the skew leans mildly lower, which is why the base sits under spot and the bear carries more weight than the bull. Conviction is low. The swing variable, Chinese import demand, is exactly the one where official data lags by two months.
What would change my mind. Two consecutive weeks of cash above three-month metal, with cancelled warrants above 90,000 tonnes, would move the base case up to $1,980. Conversely, if the October ILZSG release shows Chinese net imports falling below 100,000 tonnes annualised in the second half, the base drops towards $1,780. The same rule runs through our nickel price prediction: spreads confirm, stock lines do not.
FAQ
What is the lead price today?
LME lead cash settled at $1,886.00 a tonne on Monday 28 September 2026, with three-month lead at $1,911.50, according to the westmetall table of LME settlements retrieved on 29 September. That is down 4.17% from the first settlement of 2026 ($1,968 on 2 January) and 4.95% above the year's low of $1,797 on 15 July.
Why did LME lead stocks jump in July 2026?
Between 14 and 15 July, LME lead stocks rose by 167,200 tonnes, mostly in Singapore. Bloomberg attributed the first day's record delivery to Trafigura, and LME Insight described the metal as largely Indian-brand material tied to warehouse rent and financing deals. The inflow reflected storage economics, not a sudden collapse in battery demand.
Are electric vehicles reducing lead demand?
Not measurably so far. ILZSG data show global refined lead usage rose from 13.323 million tonnes in 2021 to 13.615 million in 2025. Lead demand is dominated by replacement 12-volt batteries for the existing car fleet, and EVs still generally carry a 12-volt auxiliary battery. First-half 2026 usage did slip 0.6%, but for mixed regional reasons.
Is the lead market in surplus or deficit?
Surplus. The ILZSG counted a 49,000-tonne refined lead surplus in the first half of 2026 and in April forecast 109,000 tonnes for the full year. The persistent LME contango, $25.50 on 28 September, is consistent with that. The group will update its forecasts at its Lisbon session on 14 to 16 October 2026.
Why use LME cash rather than a futures chart for the 52-week range?
Continuous futures charts stitch together different contract months, so their highs and lows can be roll artefacts or thin trades in an expiring contract. LME cash is the settlement for the same prompt date every day, which makes the $1,797 low and the $2,058.50 high directly comparable. Every level here is on that single basis.
Disclaimer
This article is analysis and information, not investment advice. It does not recommend any transaction in lead, LME lead contracts, or the securities of any company named. Commodity markets are volatile and capital is at risk. Scenario levels and probabilities are the author's estimates and may prove wrong. Readers should conduct their own research and consider professional advice before making any financial decision.