

I have tracked potash long enough to stop pretending it has a live screen. Potash, in the form that clears the export trade, is granular muriate of potash: potassium chloride, sold cost and freight to Brazil. The World Bank prints one monthly average of that spec and nothing finer. September 2026 came in at $367.5 a metric tonne, in the Pink Sheet dated 2 October. That is $19.4 under the August average and $37.5 under the May high of $405. The column was f.o.b. Vancouver until the Bank moved it to a Brazil CFR granular spot in January 2020, and I still mark it the same way. One delivery point. One month. No intraday print to hide a bad read. Four months of giveback are smaller than the 2022 spike and more useful than it. The spring rally has been handed back one average at a time, and the December print is the argument that is left.
The fertilizer basket and this line parted company in September. On 2 October the Bank said fertilizers as a group rose 0.4%. In the same monthly price file, diammonium phosphate rose from $793.5 a tonne in August to $800.6, and urea rose from $390 to $407.5. Potash fell 5.0%, from $386.9 to $367.5. The April Commodity Markets Outlook still has potassium chloride averaging $390 in 2026 and $365 in 2027. The nine prints so far this year average $386.53. Hitting $390 for the full year now requires a fourth-quarter average of $400.4. September, at $367.5, sits $2.5 above the whole 2027 forecast. The outlook and the tape are no longer describing the same quarter.
Key facts
- Granular muriate of potash, CFR Brazil, averaged $367.5 a metric tonne in September 2026 — World Bank Pink Sheet, 2 October 2026
- The series peaked this year at $405 in May and has fallen in every month since — World Bank monthly prices, updated 2 October 2026
- A 2026 average of $390, the April forecast, now needs a fourth quarter near $400.4; the 2027 forecast is $365 — World Bank Commodity Markets Outlook, April 2026
- DAP rose to $800.6 in September and urea to $407.5, while the fertilizer group rose 0.4% — World Bank commodity markets note, 2 October 2026
- Canpotex committed CA$500 million to Neptune Bulk Terminals, with completion expected in 2028 and shipments continuing through the work — Canpotex, 25 September 2026
- Nutrien's second-quarter average potash net selling price was $267 a tonne, offshore $259, on a controllable cash cost of $55 — Nutrien, 5 August 2026
- Latin America took 47% of Canpotex sales volumes in the second quarter of 2026, against 42% a year earlier — Nutrien, 5 August 2026
The basket rose. This line did not.
September was not a fertilizer rout. It was a split.
Triple superphosphate, the other phosphate in the same sheet, fell from $704.4 in August to $690. Urea, which had collapsed from $856.9 in April to $390 in August, ticked back up to $407.5. DAP made another high for the year at $800.6. Potash was the nutrient that kept giving ground: $405 in May, $402.5 in June, $396.5 in July, $386.9 in August, $367.5 in September. Anyone quoting "fertilizers" as one price in September was averaging away the only nutrient that had already slipped through the Bank's 2027 number.
The arithmetic on the annual forecast is plain, because the $390 figure will keep being cited as if it were a spot. The nine 2026 months in the workbook sum to $3,478.8. Twelve months at $390 would sum to $4,680. The gap is $1,201.2, or $400.4 a month across the fourth quarter. A fourth quarter that repeats September, three prints of $367.5, produces a 2026 average of $381.8. That is $8.2 under the April forecast. The forecast is an annual mean. The price a cargo is written against is a month.
I am forecasting the December month of this same series, not a revision of the Bank's annual table. Those are different objects, and mixing them is how a $390 "outlook" gets treated as a price that no longer prints.
A band, not the 2022 spike
April 2022 is still the number people reach for. Potassium chloride in this file hit $1,202 that month. September 2026, at $367.5, is 69.4% below that peak. The comparison flatters anyone who wants to call the market cheap, and it is the wrong map. From the October 2024 low of $278.1 to the May 2026 high of $405, the entire tradable band of the last two years is $126.9 wide. September sits inside it: $89.4 above the 2024 low, which is 32.1%, and $37.5 below the 2026 high. The 2024 average of the twelve months was $295.1. The 2025 average was $347.5. Both match the annual columns in the Pink Sheet. This market has been arguing inside a few hundred dollars, not inside a four-figure memory.
The climb was orderly, which is why the giveback should be read the same way.
January 2025 opened at $302. By June 2025 the month was $363.1, the high of that year, and the second half never left a shelf: $362.5 in July, $356.5 in August, $352.5 in September, $352 in October, $353.8 in November, $358.3 in December. The 2026 rally started from that shelf, not from a shortage panic. January was $366, March $380.6, April $401.3, May $405. Four months to gain $39 from the January print. Then four months to give $37.5 of it back. A market that took a year to build a $100 rally off the 2024 floor, and one spring to put on the last $39, does not need a geopolitical headline to lose $19.4 in a single month. August to September was that $19.4. It was the largest monthly drop of 2026, and it landed the series $15 above September 2025.
Affordability is the other half of that shelf, and it is a ratio, not a mood. Nutrien's 5 August MD&A still called global potash markets constructive on affordability and on demand in the main importing regions. The corn price is where a large share of North American application decisions still sit. Potash got cheaper against DAP in September by simple subtraction: DAP up $7.1, potash down $19.4. Phosphate and potash are the nutrients farmers cut first when the ratio turns, because a soil can lend potassium for a season. A cheaper potash tonne does not force application if the crop does not pay for the pass across the field.
Where December sits on the chart
The line below is the monthly average from January 2024 through September 2026, in dollars per metric tonne, CFR Brazil granular. The bull, base and bear marks are December 2026 prints of that same series, not annual averages and not mine-gate netbacks. The dotted divider is the last published month.
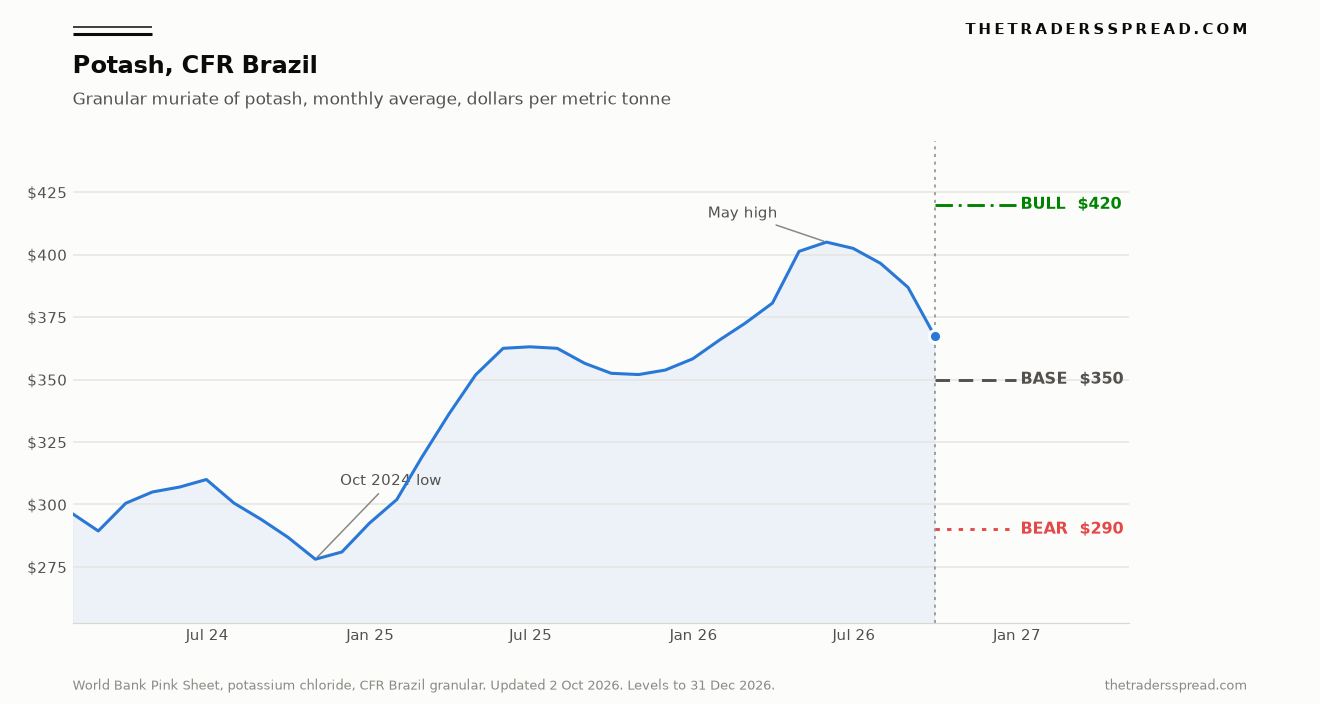
The dot at the right edge is September: $367.5. The base line sits $17.5 under it. The bull line is above the May peak. The bear line is just under the 2024 average and above the October 2024 low.
| Month | CFR Brazil, $/mt | What it marks |
|---|---|---|
| Oct 2024 | 278.1 | Low of the two-year band |
| 2024 average | 295.1 | Twelve-month mean, the bear case sits just under it |
| Jun 2025 | 363.1 | High of 2025, before the second-half shelf |
| Sep 2025 | 352.5 | A year before the latest print |
| Jan 2026 | 366 | Start of the spring rally |
| May 2026 | 405 | High of 2026, and the invalidation on this path |
| Aug 2026 | 386.9 | Last month before the $19.4 drop |
| Sep 2026 | 367.5 | Latest print, the reference for the December cases |
Read the right-hand column as places, not as a ladder of targets. October 2024 is the floor the bear case is not allowed to pretend is ancient history: it is seven quarters back. May 2026 is the ceiling the bull case has to clear, not a magnet the price owes anyone. September 2025, at $352.5, is almost the base case of $350. A December print there would be a round trip to last autumn, not a new regime.
| December 2026 case | Print, $/mt | Against September |
|---|---|---|
| Bear | 290 | $77.5 lower, 21.1% |
| Base | 350 | $17.5 lower, 4.8% |
| Bull | 420 | $52.5 higher, 14.3% |
Repeat September's $19.4 drop three more times and December is about $309, not $290. The spring rally needed four months to gain $39 off January. Both wings of the table are faster than the path that printed. That is why neither is the base.
Producers are not the benchmark
On 5 August, Nutrien's results still described a constructive potash market. Ken Seitz, the company's president and chief executive, said: "In the first half of 2026, Nutrien delivered record potash sales volumes, strong growth in proprietary products margins and further enhanced the reliability and cost position of our nitrogen assets in a dynamic global operating environment." The MD&A kept a global shipment range of 74 to 77 million tonnes for 2026, "consistent with consumption," and lifted the company's own potash sales guidance to 14.2 to 14.8 million tonnes. Second-quarter production was 3.996 million tonnes, against 3.531 million a year earlier. Supply, in the producer's own numbers, was not the thing that broke.
The price that broke is not the price Nutrien books.
For the quarter ended 30 June the average potash net selling price was $267 a tonne, up from $248 a year earlier. North America was $295. Offshore was $259, up from $237. The company said the net selling price rose because benchmarks were higher, "partially offset by higher offshore freight and insurance costs." June's CFR Brazil average was $402.5. Do not subtract $259 from $402.5 and call the remainder freight. The offshore figure is a quarterly blend of every offshore market, taken further back in the chain than a Brazil CFR cargo. Controllable cash cost was $55 a tonne in the quarter, the same as a year earlier. A $55 cost against a $367.5 benchmark means the monthly print is a demand and logistics outcome, not a cost that anyone is obliged to defend.
Canpotex's own mix says the Brazil-facing book was busy while the benchmark was still near $400. In the second quarter, Latin America was 47% of Canpotex sales volumes, up from 42% a year earlier. Other Asian markets excluding China and India were 23%. China was 11%. India was 4%. The benchmark this piece uses is the Brazil CFR leg inside that Latin American share, not the share itself. Volumes into the region were not the missing bid of the spring. The bid softened in the monthly averages after the MD&A was written: July still $396.5, August $386.9, September $367.5. Nutrien also said Brazilian soybean acreage was expected to rise moderately from the prior year, with purchasing still tied to credit and affordability. The soybean market is the crop on the other side of that sentence. Acreage is not the same thing as a prompt cargo.
Gordon McKenzie, president and chief executive of Canpotex, was not talking about the September print on 25 September. He was talking about a terminal. "The world will need more potash, and Canada should be the country that supplies it," he said in the company's release that day. "That starts with reliability. Customers need confidence that Canadian potash will arrive when they need it, year after year." The project is CA$500 million at Neptune Bulk Terminals in the Port of Vancouver, Canpotex's largest supply-chain investment, replacing shiploaders, conveyors and the dumper pit that unloads railcars. Completion is expected in 2028. Shipments continue through the work. Canpotex already moves more than 15 million tonnes a year. None of that adds a tonne in the fourth quarter of 2026. The sellers of those tonnes are spending against the next decade, not against a September average.
Put the August language next to the September number and the tension is the story. A producer that had just reported record first-half volumes, a higher netback and a Latin American share of 47% called the market constructive. Six weeks later the Brazil CFR month was $29 under the July print. The tonnes had moved. The monthly average did not hold. That is what a benchmark with no screen does: it revises the quarter after the quarter has been described.
Where I put December
The base case is a December print of $350, $17.5 under September, about 4.8%. It sits on last autumn's shelf: September 2025 was $352.5 and October 2025 was $352. I put about half the weight there. The path is a grind, not a break. No new supply shock is required, and the spring rally does not have to return. If December is $350 and the two months before it only drift, the 2026 average finishes in the low $380s. The April forecast of $390 is then missed by several dollars. That is a missed annual mean, not a collapse.
RelatedMolybdenum Price Prediction: $86,000 Bull vs $70,000 Bear
The bear case is $290: $77.5 under September, 21.1%, just under the 2024 average of $295.1 and $11.9 above the October 2024 low. About three in ten, for a December print at or under that number. Three more months of September's $19.4 drop land near $309, so $290 needs a faster fall than the worst month of 2026, and it needs the shelf near $352 to fail. That would hand back the 2025-26 rally. It is the tail, not the centre.
The bull case is $420, $52.5 above September and $15 above the May high. About one in five. January to May gained $39 in four months. This wing asks for $52.5 in three, which would also mean May was a pause rather than the top. One December print at $420 does not produce the $400.4 fourth-quarter average the $390 annual forecast now needs. October and November would have to do much of that work.
A published month would change this, not a headline. A Pink Sheet print back through $405, the May high, retires the bearish lean. That is the invalidation: the spring giveback would have been retraced. The reference stays September's $367.5, and the level this path points at is $350. A month under $340 before December would pull the base toward $290. The Bank's next update is 3 November. A firmer wheat price would help the affordability point Nutrien made in August. It would not rewrite a Brazil CFR month already in the file.
Frequently asked questions
What spec is this potash price prediction using?
Granular muriate of potash, which is potassium chloride, on a cost-and-freight Brazil basis. The World Bank's monthly potassium chloride series has used that spec since January 2020. Before then the same column was an f.o.b. Vancouver price. September 2026 averaged $367.5 a metric tonne, published in the Pink Sheet on 2 October 2026. It is not a US retail quote in dollars per 2,000-pound ton, and it is not a mine netback.
Why is the bull case $420 and the bear case $290?
$420 is above the May 2026 high of $405, so a December print there would more than erase the decline from the spring peak. $290 is just under the 2024 average of $295.1 and above the October 2024 low of $278.1. Both sit on the correct side of the September print of $367.5. The base case, $350, is the print in between, close to where this series spent the autumn of 2025.
How can the fertilizer group rise while potash falls?
The Bank said the fertilizer group rose 0.4% in September. Inside the same monthly file, DAP rose from $793.5 to $800.6 and urea rose from $390 to $407.5, while potassium chloride fell from $386.9 to $367.5. A group average can rise when phosphate and nitrogen do the lifting. This potash price prediction is about the potassium chloride line alone. It is not a view on the fertilizer basket.
Does the Neptune terminal spending change the 2026 price?
Not on this horizon. Canpotex said on 25 September 2026 that the CA$500 million rebuild of shiploaders, conveyors and the dumper pit at Neptune Bulk Terminals is expected to finish in 2028, and that customer shipments continue through the work. The company already moves more than 15 million tonnes a year. The project is about reliability into the next decade. It does not add tonnes in the fourth quarter of 2026.
What would retire this bearish lean?
A later Pink Sheet month back through $405, the May 2026 high. That is the invalidation. The reference print is September's $367.5 and the base case points at $350 by December. A month under $340 before then would move the base toward $290, because the 2025 shelf would have failed early. These are readings of one monthly average. They are not a reason to take a position in the physical, or in a producer.
This is analysis of a published benchmark, not a recommendation to take a position in potash, fertilizer shares, or any related contract. The December figures are scenarios for one monthly average of granular muriate of potash, CFR Brazil. They can be wrong. Capital put at risk on the back of a forecast can be lost.