

Butter’s CME Grade AA spot average for 26–30 October 2026 was $1.3145 a pound, 4.82 cents under the $1.3627 USDA survey price for the week ending 24 October.
Those two figures share a grade name and get collapsed into “the cash butter print,” yet they record different sales on different days with different weights. The November cash-settled butter future, which Dairy Market News quotes in cents per pound, settled on 29 October at 136.300 cents. Divided by 100, the board price is $1.3630, three-hundredths of a cent from that survey week and 4.85 cents above the spot-week average. The future sat with the survey. The spot week sat on its own. The same butter input then enters milk prices and comes out in two sizes: USDA’s September component average of $1.4462 a pound produced a butterfat price of $1.4762, a Class III price of $16.04 per hundredweight and a Class IV price of $18.94. The butterfat leg is common to both classes, so the $2.90 gap is the skim. With cheese, dry whey and nonfat dry milk held fixed, one extra cent of survey butter moves Class IV by about 4.24 cents a hundredweight and Class III by about 0.13 cents, because the protein credit hands most of the fat move back.
Updated 31 October 2026
Key facts
- CME Grade AA butter closed at $1.3575 a pound on Friday 30 October 2026, up 3.75 cents from Thursday’s $1.3200, and the five daily closes averaged $1.3145, which was 3.45 cents under the prior weekly average. Source: USDA AMS Dairy Market News, Volume 93, Report 44, week of 26–30 October 2026.
- Cash-settled butter futures for November settled at 136.300 cents a pound on 29 October 2026, equal to $1.3630, with October at 135.600 cents and December at 138.925 cents the same day. Source: USDA AMS Dairy Market News, Volume 93, Report 44, CME futures table, 26–30 October 2026.
- The National Dairy Products Sales Report weighted butter at $1.3627 a pound for the week ending 24 October 2026, on reported sales of 2,823,999 pounds. Source: USDA AMS NDPSR-0758, 28 October 2026.
- The September 2026 product-price average for butter was $1.4462 a pound, Class III milk was $16.04 per hundredweight, Class IV was $18.94, and the butterfat price was $1.4762 a pound. Source: USDA AMS Announcement of Class and Component Prices, 30 September 2026.
- The butterfat formula in that announcement is (butter price − $0.2272) × 1.211, and each class price then uses 3.5 pounds of butterfat in a hundredweight of milk at 3.5 percent fat. Source: USDA AMS class-price methodology, 30 September 2026, and 7 CFR 1000.50 as displayed on eCFR, current as of 29 October 2026.
- Advertised conventional one-pound butter averaged $3.68 across 8,115 store ads for the feature window 24 October through 5 November 2026. Source: USDA AMS Weekly Grocery Store Dairy Feature Activity, Volume 93, Number 44, 30 October 2026.
Two averages, six days apart
A newer screen treats “cash butter” as one cell. USDA’s own weekly bundle for 26–30 October contains several, and the dates on them refuse to line up.
The CME spot call is the daily carlot auction, and Dairy Market News states the butter carlot as 40,000 to 43,000 pounds. The weekly average is the simple mean of the five closes, $1.3000, $1.3100, $1.2850, $1.3200 and $1.3575, which divides out to $1.3145. Friday’s 3.75-cent rally moved the close much more than the average, and the Friday close sits 4.30 cents above that weekly mean, so two “prints” from the same auction already disagree.
The survey price samples a different population. The National Dairy Products Sales Report takes sales from plants that sell a million pounds or more a year of the covered products, and fifteen entities report butter. The covered product is salted butter at 80 percent butterfat, fresh or from storage, in 25-kilogram and 68-pound boxes meeting USDA Grade AA, and pounds sold do the weighting. For the week ending 24 October the weighted price was $1.3627 on 2,823,999 pounds. Weekly figures can be revised for four weeks after they first appear, which is why the 17 October price in that release is marked revised at $1.3538, while monthly class prices stay at the first announcement even if a later weekly revision touches a week that went into them.
The grade stamp matches across those two averages, while the sellers, the days and the weighting differ, and plant tickets add a further band around the auction. Dairy Market News put bulk butter overages that week from 2 cents under the market to 5 cents over it across all regions, with first-sale ranges on an 80 percent butterfat basis of −2.00 to +5.00 cents in the East and the Central region and −2.00 to +3.00 cents in the West. A churn can clear Grade AA butter two cents under the call or five cents over it, and both tickets are cash business quoted against the call, so the call is the centre of a band several cents wide.
| What it records | Reference figure | Dated | |
|---|---|---|---|
| CME Grade AA spot, Friday close | Daily carlot auction close, dollars per pound | $1.3575 | 30 October 2026 |
| CME Grade AA spot, weekly average | Simple average of five daily closes | $1.3145 | Week of 26–30 October 2026 |
| NDPSR butter | Volume-weighted plant sales, Grade AA, 80 percent fat | $1.3627 on 2,823,999 lb | Week ending 24 October 2026 |
| November cash-settled butter future | Futures settlement, quoted in cents per pound | 136.300 cents ($1.3630) | 29 October 2026 |
| FMMO component butter | Volume-weighted NDPSR weeks used in Class III and Class IV | $1.4462 | September 2026, announced 30 September |
| Class III and Class IV | Milk at 3.5 percent butterfat, dollars per hundredweight | $16.04 and $18.94 | September 2026 |
Why the board is quoted in cents
Dairy Market News heads the column “cash settled butter futures” and prints it in cents per pound. Cash settled means the contract pays money when it expires, while the spot call is the session where a carlot of butter is actually bought and sold. The future is a price for a named later month, written in a unit one hundred times the dollar price that sits beside it on a mixed screen.
Left in place, a quote of 136.300 beside 1.3575 looks like a future a hundred times the cash price. Moved two places, 136.300 cents is $1.3630. On that 29 October row, October was 135.600 cents ($1.3560) and December was 138.925 cents ($1.38925), a 3.325-cent strip from October to December, each of them near the latest survey week once the unit is shared. The $1.3145 spot-week average remains the outlier, because the board is a strip of monthly prices and the auction average is one week’s mean of daily closes.
Thursday’s November settle and the survey week ending 24 October matched to $0.0003 a pound, close enough to feed the idea that the future and the survey are the same object, when they were only neighbours for an afternoon. November’s own USDA average was still awaiting release on 29 October, so the contract sat near an older survey week while the November window lay ahead, and the 24 October line still described only the week that had already ended.
September’s milk prices, rebuilt from one butter figure
Class III and Class IV are milk prices in dollars per hundredweight, and a hundredweight is 100 pounds of milk. The standard class price assumes 3.5 percent butterfat, so each hundredweight holds 3.5 pounds of fat and 96.5 pounds of skim. The formulas are in 7 CFR 1000.50 and are reprinted in the methodology of the Announcement of Class and Component Prices.
The butter input for Class III and Class IV is the monthly U.S. average AMS AA butter survey price, a volume-weighted blend of the NDPSR weeks since the previous announcement. In the product-price table that is the right-hand column, $1.4462 for September 2026. The left-hand column, used for advanced Class I and Class II skim factors, was $1.4794 that month, 3.32 cents higher, because it averages a different pair of weeks. October’s component cell was still blank on the 30 September sheet.
Butterfat starts by subtracting 22.72 cents, the manufacturing allowance in the regulation, from the survey butter price, then multiplies by 1.211. September runs ($1.4462 − $0.2272) × 1.211 = $1.2190 × 1.211 = $1.476209, which rounds to the announced $1.4762 a pound. Both class prices multiply that butterfat price by 3.5 and add 0.965 times their own skim price. September’s Class III skim was $11.27 per hundredweight and Class IV skim was $14.27.
Class III is 0.965 × $11.27 + 3.5 × $1.4762 = $10.87555 + $5.16670 = $16.04225, announced as $16.04. Class IV is 0.965 × $14.27 + 3.5 × $1.4762 = $13.77055 + $5.16670 = $18.93725, announced as $18.94. The butterfat contribution of $5.1667 is the same in both lines. The $2.90 that separates the classes is 0.965 times the $3.00 skim gap, or $2.895 before rounding. Butter set the fat, and skim, where cheese and whey on the Class III side part from nonfat dry milk on the Class IV side, set the gap.
Cheese at $1.5577, nonfat dry milk at $1.7891 and dry whey at $0.6694 filled the skim side of that same announcement, which is why the cheese contract’s own confusions live on a different page, 7 Myths Traders Repeat About Class III Milk Futures. The butter path stops at one average, one butterfat price, and two milk prices $2.90 apart.
Where Class III gives the butter back
One extra cent of butter looks, before the protein term, as if it should hit both classes equally. The direct fat leg does match. Each cent on the survey butter price raises butterfat by 1.211 cents, and 3.5 pounds of fat turn that into 4.2385 cents per hundredweight, about 4.24 cents. Class IV keeps the whole of it when nonfat dry milk is unchanged, because Class IV skim is built from the nonfat dry milk survey and the butter price stays out of that skim.
Class III opens a second door in paragraph (n). Protein starts from the block-cheese survey, subtracts a 25.19-cent allowance, and builds two pieces: the cheese margin times 1.383, which leaves butter out, and the cheese margin times 1.589 minus 0.91 times the butterfat price, all times 1.17. A higher butterfat price shrinks that second piece. Class III skim multiplies protein by 3.30 and adds an other-solids term from dry whey, held fixed here, so the shrinkage reaches the class price.
One cent of butter sent through that door leaves the two legs nearly cancelling. Butterfat rises by $0.01211 a pound, the direct fat leg adds about 4.24 cents a hundredweight, and the protein shrinkage, after the 3.30 and the 0.965, takes about 4.11 cents back. With cheese, whey and nonfat dry milk unchanged, the compact factor 1.211 × (3.5 − 0.965 × 3.30 × 0.91 × 1.17) equals 0.1326 cents per hundredweight for each cent of butter, which is the 0.13 cents Class III keeps.
RelatedDid Feeder Cattle Rise 1.475 Cents on a 12% Placement Cut?
Those multipliers are reference arithmetic on the September rule set, and they show why a firmer butter call can leave Class III nearly flat while Class IV marks the fat. September ran the other direction on the classes themselves: Class IV rose $1.58 from August and Class III fell $0.60, even as component butter eased from $1.4747 to $1.4462, because nonfat dry milk rose from $1.5985 to $1.7891 and carried Class IV skim with it.
A monthly average is a stack of survey weeks
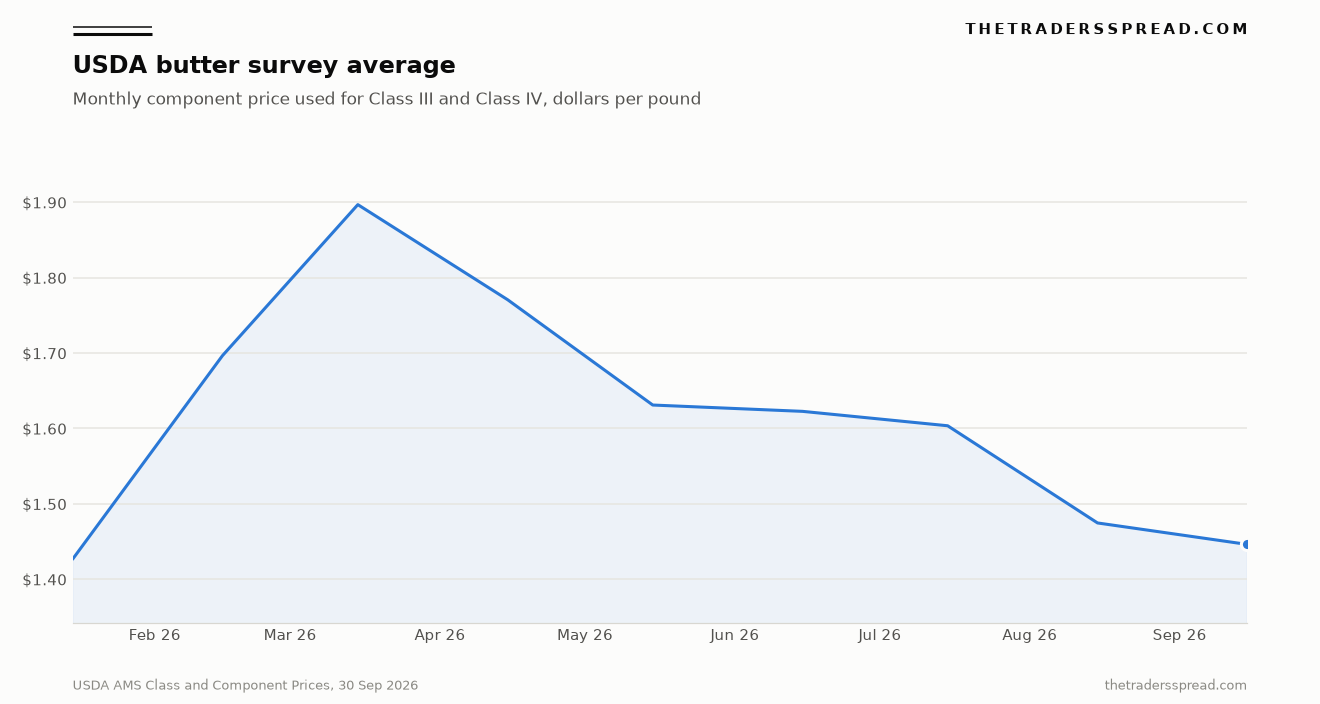
The chart is that component series alone, from January’s $1.4266 up to the March peak of $1.8969 and down to September’s $1.4462, a fall of 45.07 cents from the high. April through July printed $1.7707, $1.6311, $1.6227 and $1.6036, and August was $1.4747. Each point stacks NDPSR weeks, weighted by pounds, and the monthly class prices stay at the original release when a later weekly survey revises an input week, so the weekly print can change after the milk price has already been fixed.
NASS cold-storage holdings of butter were 295.673 million pounds on 30 September 2026, about 5 percent under August’s 311.354 million and about 16 percent above September 2025’s 253.851 million, the comparison Dairy Market News carried from the NASS release of 23 October 2026. The Daily Dairy Report’s 30 October sheet, matching the USDA close of $1.3575, counted 11 butter trades against 87 bids and 8 offers, while September’s milk price had been built from millions of pounds of surveyed sales. October’s component butter price was still ahead of that spot week, and the 29 October strip, at 135.600, 136.300 and 138.925 cents for October, November and December, was a few cents of upward slope into a later month rather than a rerun of the March-to-September decline.
The pound on a grocery circular
One further butter price travels in the same weekly USDA file, and it is the figure a household sees. For ads running 24 October through 5 November 2026, conventional one-pound butter was featured in 8,115 stores at a weighted average of $3.68, against $3.57 the prior week and $3.99 in the year-earlier column. These are advertised feature prices, so they include the retail margin, the wrapper and the promotion. Set beside Friday’s $1.3575 spot close, the one-pound feature sits about $2.32 higher, which is what a retail pack usually does relative to a bulk carlot.
Treating $3.68 as the futures price mixes a shopper’s feature with a carlot auction. Palm oil clears on Bursa Malaysia in ringgit per tonne, so a late-September move in palm oil stays a separate fat benchmark from the CME butter call, and a negotiated cash print pulling away from a futures board shows up in livestock too, including the national negotiated hog base beside the lean-hog future.
Will the next survey week sit with the call?
By the week of 26–30 October the spot mean was $1.3145 against a survey week of $1.3627, and the November future at $1.3630 on 29 October had settled nearer the survey, with the monthly stack for November still ahead.
Which clock the next official butter average resembles is the open question. If later survey weeks drift toward the $1.31 spot mean, the 4.82-cent split was mostly a mismatch of dates. If plant sales stay near the mid-$1.30s while the auction mean stays near $1.31, the future and the call keep splitting because one averages invoices and the other averages a carlot session, and Class III will still treat a one-cent difference as roughly 0.13 cents a hundredweight.
Published USDA prices and the class formulas that use them are reference data for readers comparing the prints, and the comparison stops short of a recommendation to trade any contract.