

The Stockatomics hafnium assessment, last updated 12 November 2026, prints November Hafnium at $8,927 a kilogram of contained metal, the same figure it prints for October. The summary box on that page still shows a one-month change of +77.1 percent and a six-month change of +208.5 percent. The monthly table puts 0.0 percent on both October and November, and it places the +77.1 percent label on September, the step from $5,039 in August to $8,927.
A reader who takes the November print of $8,927 and the March 2026 print of $2,893 gets a rise of 208.6 percent, sitting beside the six-month figure in the box, while the October and November rows are flat. The move that box is still advertising landed in September. The next two months are a holding pattern at the high.
That holding pattern is only one hafnium price. The US Geological Survey, in Mineral Commodity Summaries dated February 2026, publishes an Argus Non-Ferrous Markets annual average for unwrought hafnium of $781 a kilogram in 2021, $1,590 in 2022, $6,130 in 2023, $4,560 in 2024, and an estimated $3,800 in 2025. Shanghai Metals Market, writing on 4 June 2026, described an overseas path that hovered around $5,000 a kilogram from May 2024 to October 2025 and reached $13,114.75 a kilogram by April 2026. Stockatomics prints April 2026 at $2,240. Three references were open on the same afternoon, they describe three markets, and a mine headline has to name which of them it claims to move.
Updated 13 November 2026
Key facts
- November 2026 US contained hafnium on Stockatomics is $8,927 per kilogram, identical to October, and the +77.1 percent change is labelled on the September row that stepped up from $5,039. Stockatomics, page last updated 12 November 2026.
- The Argus annual average for unwrought hafnium, as carried by USGS, is an estimated $3,800 per kilogram for 2025, after $4,560 in 2024 and $6,130 in 2023. USGS Mineral Commodity Summaries, February 2026.
- SMM described an overseas hafnium price of $13,114.75 per kilogram by April 2026, after a stretch around $5,000 per kilogram from May 2024 to October 2025. Shanghai Metals Market, 4 June 2026.
- US imports of unwrought hafnium were an estimated 72 metric tons in 2025, against 64 tons in 2024 and 72 tons in 2023. USGS Mineral Commodity Summaries, February 2026.
- The leading use of hafnium metal in that USGS chapter was superalloys, and hafnium metal recycling was minimal. USGS Mineral Commodity Summaries, February 2026.
- Germany supplied 54 percent of US unwrought hafnium imports from 2021 to 2024, China 21 percent and France 12 percent. USGS Mineral Commodity Summaries, February 2026.
(1) Separation plants decide what can ship
Zircon is a ceramics mineral that happens to carry hafnium. In the February 2026 USGS chapter, the leading end use for zircon was ceramics, with foundry sand, refractories and zirconium chemicals behind it. One company recovered zircon from surface mining in Florida and Georgia as a coproduct of heavy-mineral sands, and a second company processed existing mineral-sands tailings in California. On the chapter's production table, world mine output of zirconium mineral concentrates was an estimated 1.2 million metric tons gross weight in 2025, against 1.3 million in 2024. The events paragraph in the same chapter says that output decreased by 12 percent to an estimated 1 million tons gross weight in 2025, so the chapter already carries two mine-supply figures.
Hafnium metal is a later step. USGS says zirconium metal and hafnium metal were produced from zirconium chemical intermediates by one producer in Oregon and one in Utah. The same summary leaves world primary hafnium production and quantitative hafnium reserves unquantified, and it describes hafnium metal recycling as minimal. The tonnes that can reach a mill are the output of those separation plants. The unit that can reach a superalloy mill or a gate-oxide line is separated hafnium, not a zircon reserve in a slide deck.
Stockatomics describes the same constraint from the price side. On the page last updated 12 November 2026 it treats supply as fixed by how much hafnium-free zirconium is made, because the metal comes out of zirconium refining for the nuclear industry, and it names separation plants in France, the United States, China and Russia. Extra zircon tonnes feed tiles, foundry sand and chemicals, while qualified hafnium waits on a plant that already splits the two metals and on a customer willing to qualify the lot. A large resource announcement can leave the relevant quote unchanged, because it prices an earlier stage of the chain. A more liquid metal such as Shanghai steel rebar moves on inventories, mills and freight. Hafnium's scarce step sits after the mine.
(2) Three public prices, three different markets
The chart is the Stockatomics monthly US series from January 2022 through November 2026, the history on the page retrieved 13 November 2026. Stockatomics calls it a contained-metal benchmark built from US trade data, distinct from a superalloy price and from nuclear-grade zirconium, and the line ends on the November 2026 observation.
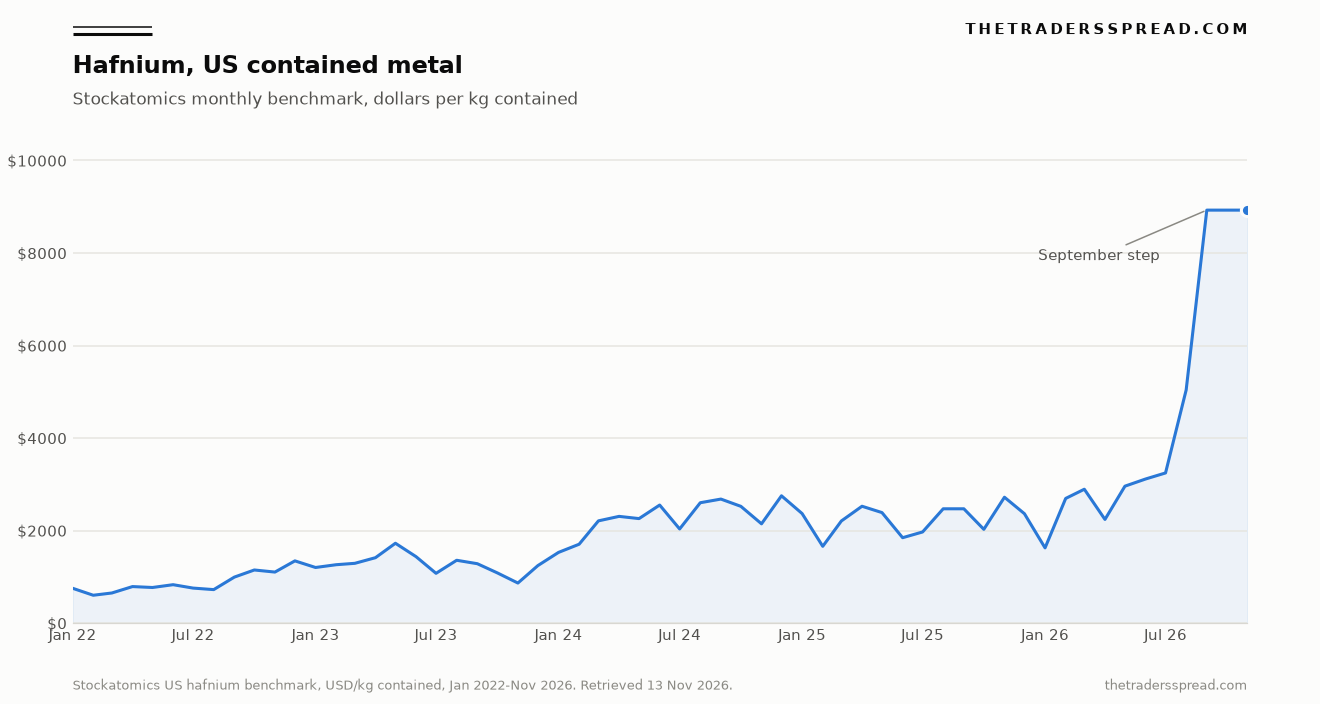
Through 2022, 2023, 2024 and 2025 the Stockatomics monthly prints sat below the Argus annual average that USGS reports for unwrought hafnium. In 2023 the monthly series ran from $864.90 in November to $1,725 in May, while the Argus annual average was $6,130. In 2025 the monthly series ran from $1,659 in February to $2,720 in November, while the Argus estimate for the full year was $3,800. In 2026 the contained-metal series left that band: January printed $1,625, also the 12-month low on the page, August printed $5,039, and September, October and November printed $8,927, above the 2023 Argus annual average of $6,130. September's jump on that page is a contained-metal print, not the overseas spot SMM described for April.
| Reference | What the source says it measures | Figure as printed | Date on the source |
|---|---|---|---|
| USGS, Argus annual average | Unwrought hafnium, dollars per kilogram, annual average | $781 (2021), $1,590 (2022), $6,130 (2023), $4,560 (2024), $3,800 (2025 estimate) | Mineral Commodity Summaries, February 2026 |
| Stockatomics US benchmark | Contained hafnium metal, dollars per kilogram, monthly | $1,625 (Jan 2026), $2,240 (Apr 2026), $5,039 (Aug 2026), $8,927 (Sep, Oct and Nov 2026) | Page last updated 12 November 2026 |
| SMM overseas note | Overseas hafnium, as SMM described the path | Around $5,000 per kg from May 2024 to October 2025, then $13,114.75 per kg by April 2026 | 4 June 2026 |
Taken as an exact $5,000 base, the April 2026 print of $13,114.75 is about 162 percent higher, which sits inside the "more than 140 percent" phrase SMM used on 4 June 2026. Stockatomics has April 2026 at $2,240. The overseas note and the US contained-metal table are naming different goods, different delivery points, or both, and calling either one the hafnium price makes the other look like a broken feed. The same split is why a polysilicon quote is a specification with a place and a timestamp, and why flake graphite and synthetic anode material clear apart. Oxide, crystal bar, an unwrought import unit and an aerospace billet can diverge under one chemical symbol.
(3) Superalloys still lead the use line USGS printed
In the 2025 domestic section of the February 2026 summary, the leading use of hafnium metal was superalloys, which belongs beside any headline that treats wafer demand as the whole market. Hafnium oxide for chips is a different shipment from turbine-alloy metal. A fab can tighten one specification while a superalloy mill remains the largest sink in that government use line.
The substitutes in that summary check the shortage rhetoric. Boron, or cadmium-silver-indium alloys, can stand in for hafnium metal in nuclear control rods, and zirconium can be used interchangeably with hafnium in certain superalloys. A year in which engine makers raise hafnium loadings, or qualify a zirconium-bearing alternative in some blades, changes the metal balance even if every zircon mine keeps its published guidance.
(4) Where a wafer gate shows up, and where it stays quiet
The SMM demand paragraph of 4 June 2026 puts hafnium dioxide in high-k metal gates at the centre of the overseas spike, tied to artificial intelligence, high-performance computing, high-bandwidth memory and advanced DRAM, and it calls the wafer requirement rigid. A qualified vendor inside a process node leaves a buyer little room to switch, so a thin quote can move hard in dollars while the tonnes stay modest next to a superalloy book. A spectacular overseas print and a quiet import average can share a calendar.
The dates in the SMM note are specific: stability around $5,000 from May 2024 through October 2025, a rise from November 2025, and $13,114.75 by April 2026. Across October 2025 to April 2026 the Stockatomics prints ran from $1,625 to $2,893, including $2,240 in April 2026. A wafer bid that lifted one overseas quote through $13,000 left the US contained-metal benchmark in a much lower range. A single mine headline accounts for neither reading.
(5) A 72-tonne import book, and the licence question
The USGS trade rows are the scale check. Unwrought imports were an estimated 72 metric tons in 2025, back to the 2023 level after 64 tons in 2024, and the 2021 row was 23 tons. Wrought imports were an estimated 12 tons in 2025. Unwrought exports were zero in 2021, shown as a dash, and an estimated 15 tons in 2025, after a 58-ton spike in 2023. Net import reliance for hafnium is left blank. Metal trade sits in the tens of tonnes, beside zircon concentrates counted in the hundreds of thousands of tonnes, and the year-by-year block follows.
From 2021 to 2024, Germany supplied 54 percent of US unwrought hafnium imports, China 21 percent, France 12 percent, the United Kingdom 8 percent and other origins 5 percent. Wrought imports in that window came 68 percent from Germany, 14 percent from China, 9 percent from France and 7 percent from Italy. The events paragraph names China and Germany as the leading global exporters of unwrought hafnium, with Germany in front of the US import book. In the column dated 31 December 2025, unwrought hafnium including powders is free of duty, and other hafnium is 4 percent ad valorem.
| US hafnium trade, metric tons | 2021 | 2022 | 2023 | 2024 | 2025e |
|---|---|---|---|---|---|
| Unwrought imports | 23 | 43 | 72 | 64 | 72 |
| Wrought imports | blank | 2 | 6 | 13 | 12 |
| Unwrought exports | 0 | 15 | 58 | 12 | 15 |
| Wrought exports | blank | 3 | 3 | 5 | 7 |
SMM's note of 4 June 2026 says China imposed export controls on hafnium from the second half of 2025, that overseas supply then gapped, and that chipmakers and traders stockpiled while some hedged. The note gives a policy and a behaviour, and it stops short of a statute article, a licence count, or a customs series a reader can add up. The April 2026 gap versus the Stockatomics print is on the two pages. How much of that gap is licensing, against grade, freight and who showed a quote, is what the note leaves open.
Argus Media, the shop USGS cites for the unwrought annual average, has described hafnium in public as one of the niche metals that can tighten when defence demand and trade measures move together.
🔒 Europe's defence ambitions are rising fast — but do we have the metals to match? In this @FT opinion piece, Ellie Saklatvala from #ArgusMedia explains why niche minerals like antimony, rhenium and hafnium could become chokepoints. Read: https://t.co/e3PHB2eVTb |… pic.twitter.com/qboXIWHZcf
— Argus Media (@ArgusMedia) April 3, 2025
An estimated 72 tonnes of unwrought imports is a handful of cargoes, so one delayed parcel can move a monthly average, provided the parcel sits inside the series a reader is holding. A control on one form in one port can send an import unit value, a superalloy surcharge and an oxide assessment along three paths. Licensing sits under separation and under the choice of quote because the opened pages show the split in numbers and show the licence channel as SMM's June account.
(6) Stocking can look like a new end market
SMM's account of early 2026 includes a demand that can reverse. Chipmakers and traders, facing a tighter overseas market, stockpiled, and some hedged. Material going into a warehouse counts as consumption on the way in and as supply on the way out. When the warehouses stop bidding, that apparent demand drops away while reactors and turbine lines stay on the programmes they already had. Reading the stockbuild as a permanent wafer requirement mistakes a one-time pull for a trend.
September, October and November on Stockatomics all print $8,927, high against the prior four years and unchanged across three readings. Flat can mean a standoff, a thin sample, or a benchmark that stepped once and waited, which sits badly beside a habit of resetting the price on every headline. The January 2026 low of $1,625, in a year that later reached $8,927, shows the series travelling in steps. Recycling is described as minimal, so the steps can be large, and they are still a weak basis for reading the next zircon drill intercept as a forecast.
RelatedNeodymium Price Prediction: $148 Bull Case vs $102 Bear Case
Evidence that would reorder the ranking
The order above runs from separation, to the choice of quote, to superalloy demand, to the wafer bid that shows up in one overseas narrative, to licensing as SMM described it, and then to stocking that can unwind. The evidence that would reorder those drivers is specific, and it is the sort of evidence a page can still use in six months.
A public series that splits shipments into superalloy, nuclear and semiconductor grades, with tonnes and a price for each, would move the wafer driver on a scale a reader can audit. The government use line says superalloys lead, and the SMM note says wafer demand drove an overseas price, and a grade split would show the weights.
Qualified output from a named separator, on a dated schedule, would test separation directly. Tonnes that arrived while the three prints stayed apart would leave the quote definition alone at the top. An outage that moved all three together would lock separation in the first line. A statute or customs table tying licences to a measured share of the overseas quote would lift licensing. The SMM sentence of 4 June 2026 is a reason to look for that document and a thin basis for ranking policy above the split between zircon and metal. A larger zircon resource would leave the order where it stands, since the February 2026 summary already prints zircon mine output in the millions of tons and leaves hafnium reserves unquantified.
Questions that survive a second reading
Why can a zircon project leave the hafnium quote where it is?
Hafnium metal is what remains after a plant makes hafnium-free zirconium. The February 2026 USGS summary leaves world hafnium production and reserves unquantified, and it names one hafnium-metal producer in Oregon and one in Utah. A new zircon mine adds feedstock for ceramics and chemicals long before it adds a qualified lot of metal. The quote a buyer cares about waits on separation capacity, on customer qualification, and on which of the public series that buyer is actually reading.
Which hafnium price should a buyer treat as the contract price?
There is a family of prints. USGS carries an Argus annual average for unwrought metal. Stockatomics publishes a monthly US contained-metal benchmark tied to US trade data. SMM, on 4 June 2026, described an overseas path that reached $13,114.75 a kilogram by April 2026. Match the form, the delivery point and the date, and keep every other print as context for the invoice.
What did USGS say the metal was used for in 2025?
In the February 2026 summary, the leading use of hafnium metal was superalloys. The same chapter says hafnium metal recycling was minimal. It names boron and cadmium-silver-indium alloys as substitutes in nuclear control rods, and it says zirconium can stand in for hafnium in certain superalloys. Hafnium oxide for chip gates is a real demand discussed by SMM, and it is a different product from the superalloy metal in the government use line.
How large is recorded US trade in hafnium?
Unwrought imports were 23 metric tons in 2021, 43 in 2022, 72 in 2023, 64 in 2024 and an estimated 72 in 2025. Wrought imports were an estimated 12 tons in 2025. From 2021 to 2024, Germany supplied 54 percent of unwrought imports, China 21 percent and France 12 percent. Those are traded tonnes of metal and wrought product, which is a different object from the gross weight of a zircon mine.
Did the overseas spike and the US benchmark move together in April 2026?
SMM's note of 4 June 2026 puts an overseas price at $13,114.75 a kilogram by April 2026. The Stockatomics monthly table puts April 2026 at $2,240 a kilogram contained. The USGS Argus average for the whole of 2025 is an estimated $3,800. The same calendar month can hold widely separated reference prints. Reading one of them as the hafnium price hides the other two, which is the expensive mistake in this market.
What would push wafer demand above separation?
A dated series that splits shipments into superalloy, nuclear and semiconductor grades, with tonnes and a price for each, would do it. So would qualified metal from a named separator, if that metal moved the three reference prints together. A statute binding export licences to a measured share of the overseas quote would lift policy too. Until one of those appears, separation and the choice of quote stay on top.
The figures above are reference prints from the sources and dates named. Hafnium assessments are thin and specification-specific, and several live levels sit behind a subscription. Readers comparing those assessments can treat the paragraphs above as general information.