

Selenium price averages and domestic byproduct output moved in opposite directions in the latest annual comparison from the US Geological Survey: the estimated US warehouse average rose 16% to $28 a kilogram, while crude selenium and anode-slime output in the United States was estimated to have decreased because primary electrolytic copper refineries produced fewer cathodes.
That pair is awkward for anyone who still prices selenium as if a selenium pit set the tonne. The February 2026 chapter, prepared by Daniel M. Flanagan of the USGS National Minerals Information Center, states that refined selenium was absent from US output. Two primary electrolytic copper refineries, one in Texas and one in Utah, produced crude selenium and selenium-bearing anode slimes, and downstream firms turned imported selenium into high-purity products, selenium dioxide and other compounds. The quoted average is a 99.5% warehouse price. The domestic physical chain stops at the slime.
More than 80% of the selenium that has been produced has come from anode slimes generated in primary electrolytic copper refining, and the chapter says reserves and resources are generally unreported at mine or country level and cannot be reliably quantified. Apparent US consumption is withheld, so the published net-import-reliance line stays above 50% for every year from 2021 through the 2025 estimate without handing a reader the consumption denominator. The selenium price is a specification quote sitting on a copper-refinery residue whose US volume the survey leaves blank.
Updated 18 November 2026 with reference figures from the USGS selenium chapter opened the same day.
A mine the reserve line refuses to name
The consensus claim treats selenium as a mined metal, so the selenium price should behave like a mine price. The February 2026 chapter is narrower. Selenium is recovered principally as a byproduct of electrolytic refining of primary copper, where it accumulates in copper-anode residues. Lead, nickel and zinc ores are other potential sources. Coal can carry selenium, and recovery from fly ash is called technically feasible and unlikely to be economical for the foreseeable future. A reserve a trader could rank by country is the object the resource paragraph says cannot be quantified.
Copper has pits and a quote of its own, including in the way traders have framed the copper price. Selenium rides in the anode after that copper is already mined, smelted and cast. Fewer cathodes at a primary electrolytic refinery remove selenium units with no selenium-mine announcement attached. The 2025 US estimate is that sequence: fewer cathodes, lower crude selenium and anode-slime output, and a higher warehouse average.
Chinese selenium production rose sharply over the decade covered by the chapter, in line with a near-75% increase in capacity to electrolytically refine copper, while copper-anode capacity more than doubled. Texas and Utah are the two US primary electrolytic copper refineries named for 2025, both credited with crude selenium and anode slimes. Refined selenium, the form the world table tries to count, is a later step those plants skipped.
Two warehouses, one nickname
The second claim is that "the selenium price" is one number. The chapter publishes two annual averages, both for a minimum purity of 99.5%, both sourced to Argus Non-Ferrous Markets. The US series is free on board, US warehouse. The European series is in warehouse, Rotterdam. They are related prints for the same purity, and in several years they were far apart.
In dollars per kilogram the US averages are $18.18, $23.07, $23.11, $24.19 and an estimated $28 for 2021 through 2025. Europe is $18.47, $19.82, $19.30, $24.86 and an estimated $29. The chapter itself calls the US step a 16% rise from $24.19 to $28, and the European step a 17% rise from $24.86 to $29 (USGS MCS, February 2026).
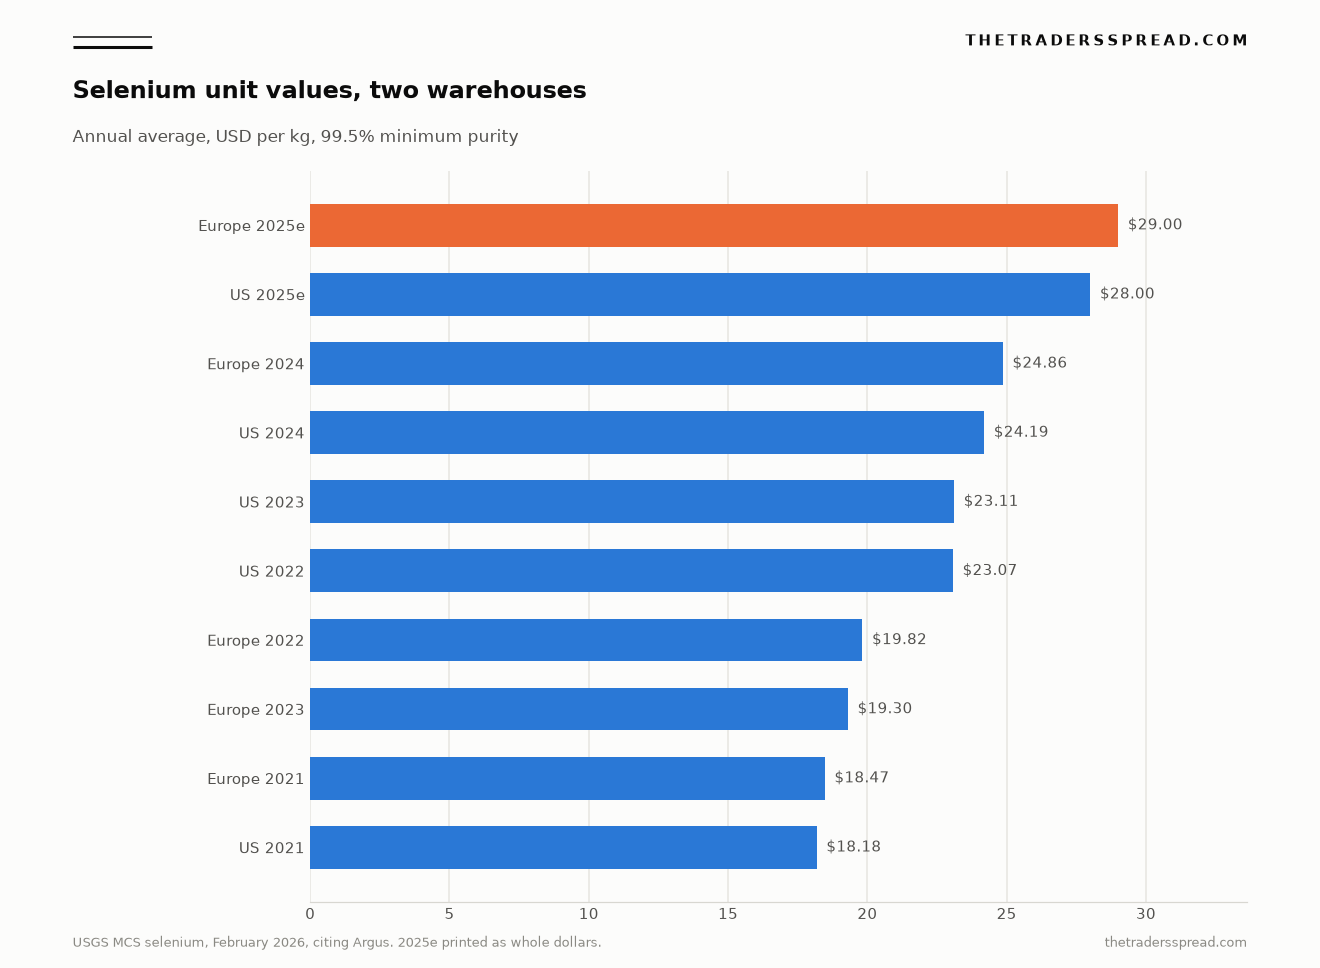
Europe led by $0.29 a kilogram in 2021, the US led by $3.25 in 2022 and by $3.81 in 2023, and Europe led again by $0.67 in 2024 and by $1 in the 2025 estimates, so quoting the selenium price meant choosing a warehouse. The average is a purity and a delivery point, the way a polysilicon quote is a specification, and it is silent on which refinery recovered the kilogram.
What the US table will and will not show
Domestic production of crude selenium and anode slimes is withheld for every year from 2021 through the 2025 estimate, as are apparent consumption and year-end producer stocks. With two refineries, a printed production number would point at the firms. Imports, exports and the two price series are the lines a reader can actually use.
| Line | 2021 | 2022 | 2023 | 2024 | 2025e |
|---|---|---|---|---|---|
| Selenium imports, metric tons | 346 | 351 | 269 | 225 | 400 |
| Selenium dioxide imports, metric tons | 71 | 10 | 8 | 5 | 9 |
| Selenium exports, metric tons | 227 | 192 | 94 | 108 | 290 |
| Imports minus exports, metal only, metric tons | 119 | 159 | 175 | 117 | 110 |
| US average, dollars per kilogram | 18.18 | 23.07 | 23.11 | 24.19 | 28 |
| Europe average, dollars per kilogram | 18.47 | 19.82 | 19.30 | 24.86 | 29 |
| Net import reliance | >50% | >50% | >50% | >50% | >50% |
Imports minus exports is arithmetic on the metal lines only, before stock changes, and it excludes dioxide. From 2024 to the 2025 estimate, imports rose from 225 metric tons to 400 and exports from 108 to 290, so the residual moved from 117 to 110 while the US average rose from $24.19 to an estimated $28. The residual was larger in 2023, at 175 metric tons, beside a US average of $23.11 (USGS MCS, February 2026). Dioxide imports were 71 metric tons in 2021, then 10, 8, 5 and an estimated 9, and the export line covers metal under Schedule B 2804.90.0000 only.
Capacity is a ceiling, output is a copper decision
The third claim treats refinery capacity as if it were selenium already won. The world table is estimated refinery production and capacity, in metric tons of selenium content. Unless noted, the figures are for refined selenium only. Countries that carried selenium inside copper ore, concentrate, blister, anodes or anode slimes, and stopped before refined metal, are excluded. The US row is labelled crude and anode slimes, and every US cell is withheld. The world production total excludes that US output.
On 6 February 2026 the US Geological Survey posted that the 2026 Mineral Commodity Summaries had been released, the edition whose selenium chapter supplies the table below.
U.S. mines produced $112 billion in nonfuel mineral commodities in 2025—an estimated $6 billion increase from 2024, used in products valued at more than $4 trillion, or one-eighth of the US economy, according to the 2026 USGS Mineral Commodity Summaries released Feb 6… pic.twitter.com/jOuhaEj507
— USGS (@USGS) February 6, 2026
Rounded world refinery production is 3,670 metric tons for 2024 and 3,800 for 2025, both excluding US output. Printed world capacity is 5,100 metric tons, with the US capacity cell withheld, so a reader has no US figure to add. China is the leading producer in the 2025 estimate and, in the chapter's words, accounted for 53% of estimated global production once countries with inadequate data are left out. The country line is 1,800 metric tons in 2024 and 2,000 in 2025, against capacity of 2,500. Two thousand divided by the 3,800-ton rounded total rounds to that 53%.
| Country | 2024 production | 2025e production | Capacity |
|---|---|---|---|
| China | 1,800 | 2,000 | 2,500 |
| Japan | 730 | 640 | 800 |
| Russia | 310 | 320 | 350 |
| Belgium | 200 | 200 | 300 |
| Canada | 130 | 130 | 180 |
| India | 88 | 90 | 100 |
| Mexico | 78 | 88 | 190 |
| Serbia | 69 | 71 | 100 |
| Poland | 68 | 67 | 90 |
| Germany | 49 | 47 | 60 |
| Peru | 53 | 48 | 65 |
| Turkey | 43 | 43 | 50 |
| Kazakhstan | 2 | 50 | 100 |
| Finland | 38 | 39 | 170 |
| South Africa | 11 | 10 | 15 |
| Uzbekistan | 2 | 2 | 3 |
| World total, rounded | 3,670 | 3,800 | 5,100 |
Finland's estimated 2025 output is 39 metric tons against 170 of capacity, Mexico's 88 against 190, and Japan's 640 against 800, with Japan also below its 2024 production of 730. Belgium held at 200 against reported capacity of 300, and Germany eased from 49 to 47 against 60. The 2024 Finland and India figures were revised from company and government reports. The printed ceiling of 5,100 metric tons still contains a withheld US cell and a stack of plants running under their own lines (USGS MCS, February 2026).
The events paragraph states a plant rate on its own line. In January 2025 the first batch of refined selenium left a recently completed plant in Kazakhstan, expected to produce approximately 75 metric tons a year at 99.5% purity. The country estimate for 2025 is 50 metric tons, with capacity of 100. One figure is an expected plant rate. The other is an estimated national total. Stacking the 75 on top of the 50 would double-count a startup the table has already tried to place.
A second blind spot sits in the footnotes. Armenia, Australia, Chile, Iran, the Republic of Korea, the Philippines, Zambia and Zimbabwe may have produced refined selenium, and the survey judged the information inadequate for a reliable estimate. Several of those names return as US import sources. The production ranking and the trade ranking answer different questions. Treating 3,800 metric tons as the whole world of refined selenium ignores a list the chapter printed in order to say it could not count them.
The duty schedule is a blank
Net import reliance is above 50% in every year of the salient table, and domestic refined output is absent, while the duty lines are free. Under normal trade relations as of 31 December 2025, selenium under 2804.90.0000 and selenium dioxide under 2811.29.2000 were both free. The government stockpile entry is none, and the depletion allowance is 14% domestic and foreign (USGS MCS, February 2026).
Selenium-metal imports in 2021–24 were Philippines 25%, Mexico 14%, Chile 12%, Poland 11% and other 38%. China, the leading refined producer in the 2025 estimate, is outside those four named sources and may sit in the residual, which the chapter leaves unsplit. The Philippines and Chile are also on the footnote of possible producers with inadequate data, so shipping origin and the refined-production rank are different columns.
Dioxide imports over those four years were Korea 78%, China 10%, the Philippines 7%, Germany 4% and other 1%. The reliance ratio uses metal imports, exports and stock changes over apparent consumption, and apparent consumption itself includes the withheld slime production, so the tonnes of consumption stay off the page even while the ratio prints as greater than 50%.
Three tonnes that share one name
Crude selenium and anode slimes are what the two US refineries produced, and that volume is withheld. Refined selenium is what the world table counts, with the US total excluded because the domestic figure is the crude-and-slime line. High-purity products, dioxide and other compounds are what US downstream companies make from imports. A slime tonne and a 99.5% warehouse tonne are different objects, and a single "supply" total would mix a residue with a specification (USGS MCS, February 2026).
A refiner's own language stays on the recovery step. Aurubis posted on 12 May 2025 that its RETORTE subsidiary had invested €7 million in an advanced selenium facility, with capacity up 20%, and called the work part of a multimetal strategy.
New milestone for #Aurubis subsidiary #RETORTE: €7 million invested in advanced selenium facility. +20 % capacity, full good manufacturing practice compliance and built for future markets. A strong step in our multimetal strategy. Read more: https://t.co/RMuaGy4Dgn pic.twitter.com/hnHAbYrNlA
RelatedWhy Rhenium Metal Can Fade to $4,400 or Reach $7,200
— Aurubis (@Aurubis_AG) May 12, 2025
Germany's chapter entry is an estimated 47 metric tons in 2025, down from 49, against capacity of 60, and the USGS page does not tie those tonnes to the RETORTE increment. The 20% in the Aurubis post is a plant figure, separate from the 3,800-ton world total, in the same way the Kazakh plant rate sits apart from the Kazakh country line (USGS MCS, February 2026; Aurubis post, 12 May 2025).
The chapter calls recycling insignificant and says most electronic scrap was exported for recovery of the contained selenium. Exported scrap is a recovery problem for the receiver, and it leaves the domestic refined total empty. The depletion allowance and the empty stockpile are a tax rule and a missing buffer, and they add no extra tonne of metal.
Metallurgy still takes the largest slice
Estimated global end uses in 2025 put metallurgy, including electrolytic manganese, at 40%, agriculture and animal health at 20%, and glass at 20%. Electronics and photovoltaics together are 10%, chemicals and pigments 5%, and other uses 5%. Thin-film copper-indium-gallium-diselenide cells sit inside that tenth, in a year when the warehouse averages were an estimated $28 in the United States and $29 in Rotterdam. Metallurgy, agriculture and glass are four fifths of the estimated split (USGS MCS, February 2026).
Amorphous silicon and cadmium telluride compete with CIGS cells. Silicon substitutes in low- and medium-voltage rectifiers, and sulfur dioxide can replace selenium dioxide in electrolytic manganese at a cost in energy efficiency. Bismuth, lead and tellurium appear in free-machining alloys, and tellurium also shares the anode-slime route covered in the note on tellurium supply and copper slime. Glass uses selenium to remove the green tint from iron in container glass, and agriculture uses it as a fertilizer additive and a feed supplement, in the same use block as the solar cells (USGS MCS, February 2026).
Evidence that would retire the six
Each claim above is a reading of one chapter, the Mineral Commodity Summaries selenium pages opened on 18 November 2026 from the edition posted in February 2026. A later chapter could retire them, and the retirement would look like new cells in the table.
The mine claim would weaken if the survey published selenium reserves it was willing to call reliable. Today it says those reserves cannot be reliably quantified, and that more than 80% of production has been anode slime from primary electrolytic copper refining. A reported primary reserve large enough to matter beside that share, or a fly-ash circuit the chapter called economical, would be new evidence. Until either appears, the parent metal remains copper and the US sites remain Texas and Utah.
The warehouse claim would weaken if the US and Rotterdam averages were replaced by one specification, or if the $3.81 gap of 2023 closed and stayed closed. The capacity claim would weaken if Finland, Mexico and Japan filled the ceilings printed beside them, and if the "may have produced" countries acquired numbers. The duty claim would weaken if 2804.90.0000 or 2811.29.2000 carried a rate other than free, or if a stockpile replaced the word none. The tonne claim would weaken if the United States appeared as refined production. The solar claim would weaken if electronics and photovoltaics outranked metallurgy in the end-use split.
One further print would retire the habit of back-solving the US market. If apparent consumption, crude production and producer stocks were published instead of withheld, the reliance ratio above 50% would become a figure a reader could check, and the 110-metric-ton trade residual for the 2025 estimate could sit beside a real consumption number. Until that cell is filled, the selenium price remains a warehouse average for 99.5% metal, and the supply behind it remains the byproduct the survey has already described.
Questions the trade data keeps attracting
Where does selenium supply come from?
Most selenium on the market has come from anode slimes at primary electrolytic copper refineries. The February 2026 Mineral Commodity Summaries puts that historical share above 80% and says mine-level reserves cannot be reliably quantified. In 2025 the US industry was two copper refineries, in Texas and Utah, making crude selenium and anode slimes, while refined metal for downstream products was imported. Lead, nickel and zinc ores are the other potential sources named.
What is the selenium price actually quoting?
The February 2026 averages are Argus Non-Ferrous Markets prices for 99.5% minimum purity. The US series is free on board a US warehouse, estimated at $28 a kilogram for 2025, 16% above $24.19. The European series is in warehouse at Rotterdam, estimated at $29, 17% above $24.86. The two prints diverged by several dollars a kilogram earlier in the decade, and both are annual reference averages for a stated warehouse.
Why does US net import reliance stay above 50%?
The chapter builds the ratio from metal imports, exports and stock changes, divided by apparent consumption, and prints it as greater than 50% from 2021 through the 2025 estimate. Apparent consumption uses withheld crude selenium and anode-slime production, so the denominator stays off the page. Selenium and selenium dioxide were duty-free under normal trade relations as of 31 December 2025, and the stockpile entry is none.
This is analysis for traders reading a supply chapter, and it is not a recommendation to buy or sell selenium or any related instrument. Warehouse averages move for reasons a single annual table can miss, and capital put at risk on a byproduct metal can be lost.