

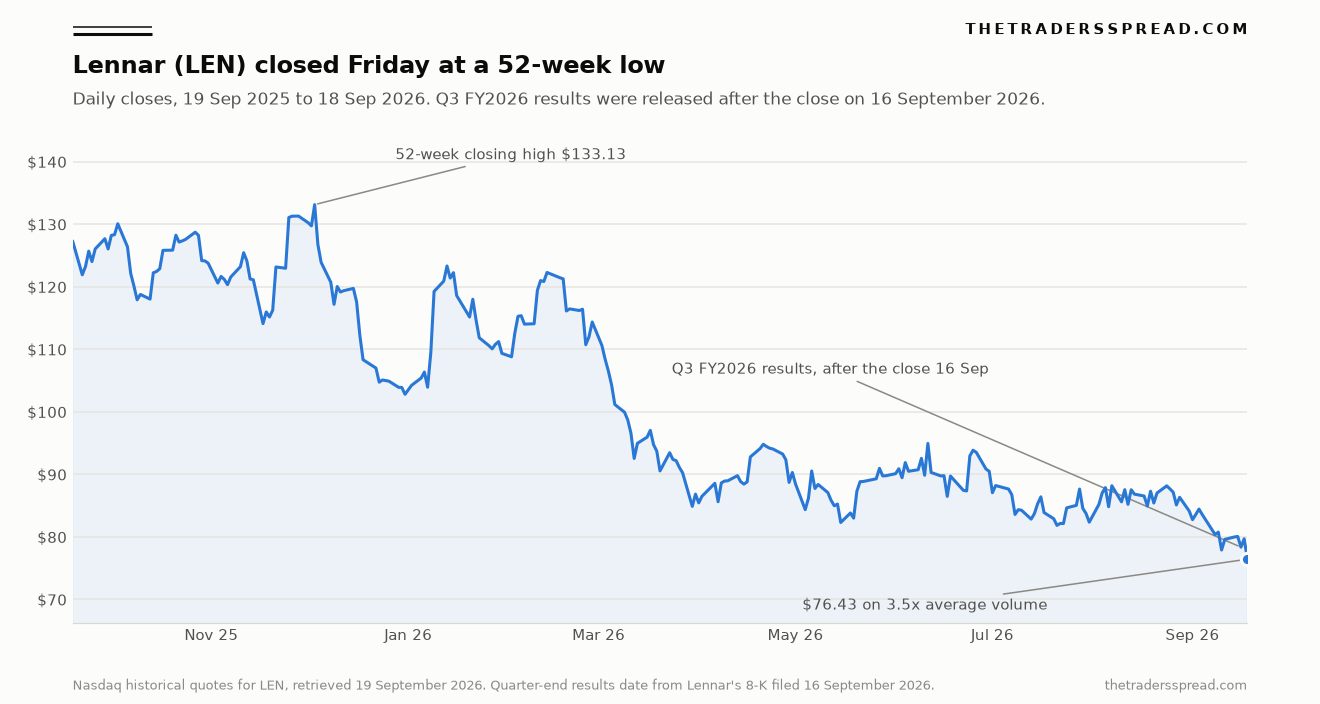
Lennar did not fall 4.1% on Friday because the Federal Reserve raised interest rates on Wednesday. The sequence rules that out. The FOMC lifted its target range a quarter point to 3.75–4.00% on 16 September 2026, and Lennar closed that session at $78.36. The company then released its fiscal third-quarter results after the bell, and on Thursday 17 September the stock rose 1.71% to $79.70, the best single-day move in its peer group. Friday 18 September is when the selling arrived: $76.43 at the close, down 4.10%, on 11.85 million shares against a prior twenty-session average of 3.41 million. That is 3.47 times normal turnover, and it produced the lowest close and the lowest print, $75.70 intraday, of Lennar's past 52 weeks.
The rates story does not survive contact with the yield curve either. Between 27 August and 17 September the Freddie Mac 30-year average went from 6.66% to 6.95%, a rise of 29 basis points, while the 10-year Treasury went from 4.67% to 4.94%, a rise of 27. The spread between them barely moved, 199 basis points to 201. Almost the entire increase in the mortgage rate that Lennar's chief executive blamed for the quarter came out of the long end of the Treasury curve, and most of it arrived before the Fed met. The effective federal funds rate did not budge from 3.63% until 17 September, the day after the decision, by which point the 10-year had already peaked at 5.01% and started falling back.
Key facts
- Lennar closed at $76.43 on Friday 18 September 2026, down 4.10%, its lowest close in 52 weeks — Nasdaq historical series for LEN, retrieved 19 September 2026
- Friday volume was 11,851,860 shares against a 3,412,578 twenty-session average, a ratio of 3.47 — same series, our arithmetic
- Third-quarter diluted EPS of $1.19 against $2.29 a year earlier, on net earnings of $284m versus $591m — Lennar 8-K exhibit 99.1, filed 16 September 2026
- Gross margin on home sales 15.8%, down from 17.5%; SG&A 9.2% of home-sales revenue, up from 8.2% — same filing
- Average sales price $372,000 carrying "approximately 12.0% in incentives", roughly $45,000 a home at that rate — same filing, our arithmetic
- Lennar bought back 3 million shares during the quarter at an average of $85.49, 11.9% above Friday's close — same filing
- Homebuilding cash fell from $3.441bn at 30 November 2025 to $1.150bn at 31 August 2026 while finished homes and construction in progress rose from $8.822bn to $10.670bn — same filing, balance sheet
Three sessions, in the order they happened
The week reads differently depending on which day you anchor to. Wednesday was the Fed and the earnings release, in that order. Thursday was the market's verdict on the numbers, and it was a mild pass: Lennar added 1.71% while D.R. Horton added 1.49%, Toll Brothers 1.27%, PulteGroup 1.10% and NVR 0.90%. Only KB Home was red, at −0.27%. A group that had just read a homebuilder report describing a "deteriorated" market did not sell the sector.
Friday broke that pattern.
Every builder fell, but Lennar fell roughly two and a half times as hard as the average of its five closest listed peers. The group's mean was −1.67%. Lennar's −4.10% is 2.43 percentage points of excess decline, on a day when the stock also traded the heaviest volume of any session since 1 December 2025. Friday 18 September was a quarterly expiry, which mechanically inflates turnover across the tape, so the volume alone does not settle the question of motive. What it does settle is that the print was not thin: a lot of stock changed hands at the low.
| Homebuilder | Thu 17 Sep close | Fri 18 Sep close | Friday change |
|---|---|---|---|
| Lennar (LEN) | $79.70 | $76.43 | −4.10% |
| KB Home (KBH) | $48.54 | $47.12 | −2.93% |
| D.R. Horton (DHI) | $140.38 | $138.02 | −1.68% |
| NVR (NVR) | $6,242.23 | $6,150.47 | −1.47% |
| PulteGroup (PHM) | $118.84 | $117.26 | −1.33% |
| Toll Brothers (TOL) | $134.32 | $133.06 | −0.94% |
Closing prices from the Nasdaq historical series for each ticker, retrieved 19 September 2026. Friday's session was the last before the 21 September reopen.
Set against the year, Friday looks less like a shock and more like a destination. Lennar closed at $133.13 on 3 December 2025 and has lost 42.6% of that. It entered 2026 at $102.80 and is 25.7% lower. Year on year the decline is 40.0%. Friday's 4.10% drop does not even rank among the six worst sessions of the past twelve months; 30 March 2026 took 5.95% out of the stock in a day. The move mattered because of where it landed, not because of its size.
What the Fed moved, and what moved the mortgage
Stuart Miller, Executive Chairman, Chief Executive Officer and President of Lennar, put the cause plainly in the release: "Mortgage rates increased through the quarter, with the 30-year rate at approximately 6.8% at quarter end and even higher since. Rates are responding as inflation remains above the Fed's target, driven by geopolitical tension and higher oil prices." The last clause is the operative one, and it points away from the policy rate. Crude has been the dominant inflation input of the past quarter, a move we tracked as WTI climbed 21%, and it is term premium rather than the overnight rate that transmits that into a 30-year mortgage.
The arithmetic supports him and contradicts the headline framing at the same time.
A 30-year fixed mortgage is priced off agency mortgage-backed securities, which key off the 10-year Treasury, not off the federal funds target. Freddie Mac's weekly survey rate ran 6.66% on 27 August, 6.71% on 3 September, 6.76% on 10 September and 6.95% on 17 September. The 10-year constant-maturity yield over the same stretch went 4.67%, 4.80% on 8 September, 5.01% on 16 September and 4.94% on 17 September. Subtract one from the other and the primary-secondary spread sat at 199 basis points in late August and 201 in mid-September. Nothing in the mortgage plumbing changed. The long bond simply repriced, and it did most of that repricing in the week running into the meeting rather than after it. Traders had been carrying the September decision as a live hike for a fortnight, something the event contracts had already marked up, and the near-total collapse in 2026 cut expectations had been visible for weeks before that.
The macro release that landed in the middle of the week is the one worth reading twice. The Census Bureau and HUD published August new residential construction on Thursday 17 September, release CB26-147. Total starts came in at a 1,275,000 seasonally adjusted annual rate, 2.6% below July and 1.2% below August 2025. Single-family starts, the line that actually maps to Lennar, rose 7.6% month on month to 918,000. Completions told the opposite story: 1,128,000 overall, down 11.9% on the month and 27.1% on the year, with single-family completions at 816,000.
Builders are still breaking ground and finishing fewer houses. That gap is the whole argument over what the sector's inventory is worth.
Twelve per cent of the price is now the incentive
Lennar delivered 20,840 homes in the quarter to 31 August, 3% fewer than a year earlier and inside its own 20,500 to 21,500 guidance. New orders of 20,879 were 9% lower. Revenues from home sales fell 6% to $7.7bn on an average sales price of $372,000, down from $383,000. Gross margin came in at 15.8% against 17.5%, which the company attributed to lower revenue per square foot and higher land costs, partly offset by construction savings. Selling, general and administrative costs rose to $714m from $676m and to 9.2% of home-sales revenue from 8.2%, on what the filing calls "less leverage as a result of lower revenues and an increase in marketing and selling expenses."
Miller's own description of the price is the number to hold onto. The $372,000 average reflects "approximately 12.0% in incentives, along with base price adjustments necessary to sustain volume." Run that rate against the disclosed average and roughly $45,000 a home is being handed back at the closing table, most of it through the rate buydowns that Lennar's in-house mortgage arm finances. That segment's operating earnings fell to $129m from $177m, and stripping out a $39m one-time litigation accrual reversal leaves about $90m, roughly half of last year, on what the company describes as lower profit per locked loan and lower lock volume.
The operating metrics underneath all of this are genuinely better. Cycle time hit a record low of 116 days, from 121 the previous quarter and 126 a year ago. Construction cost per square foot fell another 1% sequentially and 6% year on year, and is 14% below the fourth-quarter 2023 baseline. Completed unsold inventory came down to 1.8 homes per community from 2.1. Across 1,713 active communities the starts pace and the sales pace both ran at 4.1 homes per community per month, which is the even-flow condition the strategy is built around. None of that showed up in earnings, because every dollar of efficiency has been spent keeping the sales pace at 4.1.
Where the cash went
The balance sheet is the part of this filing that has drawn the least commentary and carries the most information. Homebuilding cash and equivalents stood at $1,150m on 31 August against $3,441m at the 30 November 2025 year end, a drawdown of $2,291m in nine months. Over the same period, finished homes and construction in progress rose from $8,822m to $10,670m, an increase of $1,848m, or 20.9%, at a company whose nine-month deliveries fell to 58,222 homes from 59,549.
Two and a quarter billion dollars of cash has been converted into houses standing on the ground while the rate of sale went down.
Land is not where it went. Land and land under development actually shrank, from $1,099m to $865m, and Lennar now owns fewer than 2.5% of the roughly 488,000 homesites it controls, the residue of the Millrose Properties separation that also pushed the effective tax rate up to 26.4% from 24.4%. The capital moved from dirt into vertical construction, which is a far less patient asset. A finished spec home carries carrying costs, a warranty clock and an incentive bill that grows the longer it sits.
Buybacks absorbed the rest. Treasury stock rose from $6,458m to $7,450m over the nine months, $993m of repurchases, of which $256m came in the third quarter at an average price of $85.49. Friday's close sits 10.6% below that average. Weighted average diluted shares fell 7.0% year on year, to 237.8 million from 255.6 million, and earnings per share still halved. Senior notes and other debts payable rose to $4,297m from $4,085m even after the $400m redemption of the 5.25% notes due June 2026, with $650m drawn on the $3.1bn revolver at quarter end and homebuilding debt to total capital at 16.6%. A builder retiring one note while drawing a revolver and buying stock is running three capital policies at once, the same tension FedEx displayed when it re-issued debt it had just retired.
The fourth-quarter arithmetic nobody has run
Lennar guided to 22,000 to 23,000 deliveries and 19,500 to 20,500 new orders for the quarter ending 30 November. At the midpoints that is 22,500 out and 20,000 in, a book-to-bill of 0.89. Third-quarter book-to-bill was 1.00, with 20,879 orders against 20,840 deliveries. Backlog already stands at 16,857 homes worth $6.345bn, against 16,953 homes worth $6.648bn a year ago, so the dollar value is 4.6% lower on a flat unit count. Guidance implies that backlog falls by roughly 2,500 homes over the next quarter, and it does so on a gross margin guided at 15.5% to 16.0%, below the 15.8% just printed at the top of that range and at it at the bottom. Full-year deliveries were cut to 80,000–81,000 from the 82,000–83,000 discussed a quarter ago.
Valuation is where Friday's close becomes interesting rather than merely low. On the 237.8 million weighted average diluted shares reported for the quarter, $76.43 values the equity at about $18.17bn. Stockholders' equity at 31 August was $21.559bn, so the stock closed at roughly 0.84 times book. Strip the $3.442bn of goodwill carried since the CalAtlantic era and tangible book is $18.117bn, which puts Friday's close at almost exactly 1.00 times tangible book value. The market is now paying nothing for the operating franchise and the brand, and marking the inventory at cost.
New-home supply gives that mark some context. The Census and HUD monthly supply of new houses stood at 9.6 months in July 2026, against roughly six months at balance. An industry sitting on nine-plus months of supply, still starting single-family homes at a 918,000 annual rate, is an industry that has to clear inventory on price. Lennar has been explicit that it will.
RelatedConstellation Energy (CEG): $360 Bull vs $248 Bear
What this changes
The useful conclusion is not about Friday. It is that the market has stopped valuing Lennar as an earnings stream and started valuing it as an inventory position, and the company's own disclosures explain why. Volume is being defended with roughly $45,000 a home of incentives. Margin has been held at 15.8% only by cutting construction costs 6% year on year and cycle time to 116 days, and both of those levers have finite travel. Meanwhile $2.29bn of cash has become $1.85bn of additional houses in progress, and the Q4 guide says the backlog that would absorb them shrinks by about 2,500 units.
That reframes what to watch into two measurable things. The first is the incentive line. Lennar has disclosed it as a percentage of price for several quarters, and the direction of that single number, against the 15.5% to 16.0% margin guide, decides whether the fourth quarter clears inventory or simply discounts it. The second is finished homes and construction in progress on the balance sheet at 30 November. If that figure rises again from $10.670bn while deliveries land at the 22,000 to 23,000 guided, the conversion of cash into standing houses has not reversed, whatever happens to the headline margin.
What would make the rate story true after all is a widening of the primary-secondary spread rather than a further rise in the 10-year. At 201 basis points the spread is behaving normally. If it pushes materially wider while Treasury yields stay flat, mortgage capacity itself is tightening, and that would hit the Financial Services segment's lock volumes directly, on top of the buydown cost already running through gross margin. Nothing in the September data shows that yet.
The one thing Friday genuinely settles is that Lennar now trades at the level where its own board was not buying. Three million shares went at $85.49 during the quarter. Whether the company keeps repurchasing at $76.43, and at what pace, will be disclosed in the fiscal fourth-quarter release in January, and it is a cleaner read on management's view of the inventory mark than any guidance sentence. Broader equity positioning, including where the index itself sits into year-end, is a separate question from whether a builder's houses are worth what they cost to build.
Frequently asked questions
Did Lennar fall because the Fed raised rates?
No. The FOMC raised its target range to 3.75–4.00% on Wednesday 16 September and Lennar closed that day at $78.36, then rose 1.71% on Thursday. The 4.10% decline came on Friday. The effective federal funds rate did not move until 17 September, and the 10-year Treasury yield had already peaked at 5.01% and turned lower by then.
Was Friday's move specific to Lennar or sector-wide?
Both, in different proportions. All six major listed builders fell on 18 September, but the five peers averaged −1.67% against Lennar's −4.10%. That leaves 2.43 percentage points of company-specific decline. Friday was also a quarterly expiry, which lifted turnover to 3.47 times Lennar's prior twenty-session average.
What did Lennar actually report for the third quarter?
Diluted earnings per share of $1.19, or $1.23 excluding $53m of mark-to-market losses on technology investments and $39m of net one-time items in Financial Services, against $2.29 a year earlier. Deliveries fell 3% to 20,840 homes, new orders fell 9% to 20,879, gross margin on home sales was 15.8% and revenues were $8.0bn.
How large is the incentive Lennar is paying to sell a house?
The company disclosed an average sales price of $372,000 "reflecting approximately 12.0% in incentives." Applied to that average, the rate implies roughly $45,000 per home, most of it delivered as mortgage rate buydowns funded through the Financial Services segment, whose operating earnings fell to about $90m excluding one-time items from $177m.
What does Lennar's valuation look like after Friday?
On the 237.8 million weighted average diluted shares reported for the quarter, $76.43 implies an equity value near $18.17bn. Stockholders' equity at 31 August was $21.559bn, and tangible book after removing $3.442bn of goodwill was $18.117bn. Friday's close is therefore about 0.84 times book and roughly 1.00 times tangible book.
When does Lennar next report?
The fiscal year ends 30 November 2026, and fourth-quarter results have historically been released in the second half of January. Guidance for that quarter is 22,000 to 23,000 deliveries, 19,500 to 20,500 new orders, a gross margin of 15.5% to 16.0%, an average sales price of $370,000 to $380,000 and Financial Services operating earnings of $90m to $95m.
Disclaimer
This article is analysis and information, not investment advice, and it does not recommend any position in Lennar or any other security. Every figure is sourced to a named primary document with its retrieval date. Prices reflect the close of Friday 18 September 2026, the most recent completed US equity session at the time of writing. Trading and investing carry risk, including the loss of the capital committed.