

On Thursday 1 October 2026, at 06:42:03 Eastern Time, EDGAR accepted a Form 8-K from Accenture plc. The submission header records that stamp as 20261001064203, and EDGAR keeps the field in Eastern Time. Accession number 0001467373-26-000037, items 2.02 and 9.01, primary document acn-20261001.htm. Exhibit 99.1 is the news release dated that day in New York, for the quarter and the fiscal year ended 31 August 2026. The filer header gives the business address as 1 Grand Canal Square, Grand Canal Harbour, Dublin, incorporation code L2, Ireland, CIK 0001467373, file number 001-34448.
The release set a conference call for 8:00 a.m. Eastern, an hour and a half before the New York cash open, with a US dial-in of +1 (877) 883-0383 and access code 353302. The 8-K was already public when the regular session began.
The session that followed
Accenture's Class A ordinary shares trade on the New York Stock Exchange under the ticker ACN. Nasdaq describes the line as Class A ordinary shares of an Irish company.
The Nasdaq historical row for 1 October 2026, retrieved with the quote summary at 07:33 UTC on 2 October, shows an open of $215.98, a high of $227.63, a low of $211.035 and a close of $212.30, on volume of 28,986,130 shares. Wednesday 30 September closed at $183.37. The difference is $28.93, which is 15.78% of that prior close. The quote page, not a live feed and stamped 1 October, showed the same three figures. At one decimal place, 15.78% is 15.8%. The percentage is the change in the closing price. Yahoo's chart endpoint returned HTTP 429 on this pull, so the price file is Nasdaq, not a search snippet.
The open was 17.78% above Wednesday's close. The high was 24.14% above it. The close was 1.7% under the open and 6.73% under the high, and $1.27 above the printed low. The gap did not hold. The close sat near the bottom of a wide range. The day was still up 15.78%.
Volume was 5.44 times the average of the 20 sessions from 2 September through 30 September, 5,332,384 shares. Wednesday had already traded 10,537,790 shares as the close rose from $174.47 on Monday 28 September to $183.37, a 5.1% bounce.
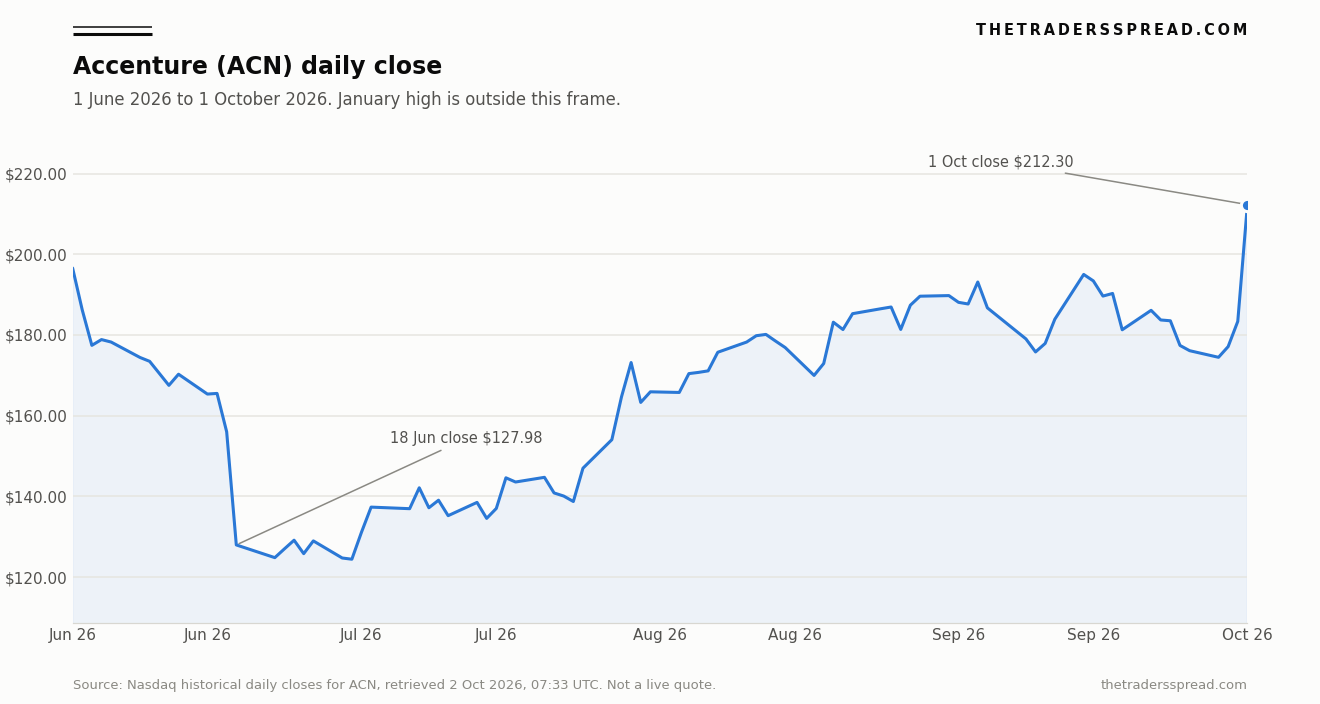
The chart is daily closes from 1 June 2026 to 1 October 2026. No forecast lines. The 14 January high is outside the frame on purpose.
The high the chart leaves out
On Wednesday 14 January 2026 the shares traded as high as $291.09 and closed at $288.54. The same Nasdaq quote pull listed a 52-week range of $118.15 to $291.09. The daily files place that high on 14 January and the $118.15 low on Monday 22 June. From the January close to Thursday's $212.30 is a decline of 26.4%. From the June intraday low, Thursday's close is 79.7% higher.
Thursday was not a 52-week high.
The last close at or above $212.30 before Thursday was Friday 6 March, at $215.00. From 9 March through 30 September the highest close was 9 March itself, at $209.36. Thursday is the first close above $212 since 6 March, and it is still under that March close. The intraday high of $227.63 traded through that March close. The finish did not.
Inside the chart window, 1 June closed at $196.59 and Wednesday 17 June at $156.01. On Thursday 18 June the shares opened at $126.50, traded between $125.60 and $134.70, and closed at $127.98, down $28.03, or 17.97%, on 41,744,290 shares. Volume was 8.38 times the prior 20-session average of 4,980,114 shares, from 20 May through 17 June. Tuesday 30 June closed at $124.44, the lowest close in this file.
The June filing on the day of the break
18 June 2026 is also the filing date of the third-quarter 8-K, accession 0001467373-26-000031. The exhibit put revenue at $18.72 billion, up 6% in US dollars and 3% in local currency, slightly above the midpoint of a range of about $18.35 billion to $19.0 billion. Bookings were $19.32 billion, down 2% in dollars and 3% in local currency. The outlook table set full-year local-currency growth at 3% to 4% as of 18 June, beside 3% to 5% as of 19 March. Excluding an estimated 1% from US federal work, June's column was about 4% to 5%, against about 4% to 6% in March. June's GAAP earnings range was $13.38 to $13.50, and the adjusted range was $13.78 to $13.90.
That release also published the fourth-quarter range the October document says the company beat: revenue of $17.75 billion to $18.4 billion, local-currency growth of 1% to 5%, foreign exchange about a 0.5% headwind. The October release writes the top as $18.40 billion. Same band.
A one-point trim, and a bookings decline, share a date with a 17.97% drop. The release does not assign the drop a cause.
What the fourth quarter cleared
Julie Sweet, Accenture's chair and chief executive, said in the 1 October release:
"We exceeded our fourth-quarter revenue guidance range and capped off another year of broad-based growth across our business, grew adjusted EPS 8%, returned a record $11.5 billion to shareholders and reached a new high of 141 quarterly client bookings of $100 million or more. These results reflect the continued trust our clients place in us to help them reinvent and create value, the high level of innovation we bring every day and the extraordinary commitment of our Reinventors to our clients' success."
Fourth-quarter revenue was $18.68 billion in the narrative and $18,679,110 thousand on the income statement, up 6% in US dollars and 7% in local currency from $17,596,260 thousand. The release says that was above $17.75 billion to $18.40 billion. On the rounded figure, the print is about $280 million over the top of the dollar range. Local-currency growth of 7% is two points over the 1% to 5% band. Foreign exchange was about a 0.8% headwind, worse than the 0.5% assumption carried from the third-quarter release, so the dollar beat was not a currency gift.
Full-year revenue was $74.18 billion, $74,183,445 thousand on the statement, up 6% in dollars and 5% in local currency from $69,672,977 thousand. Five percent is one point above the June band of 3% to 4%, and it matches the top of the March band of 3% to 5%. Full-year foreign exchange was about a 2% tailwind, which is why dollar growth ran ahead of local-currency growth. The fourth quarter had the opposite currency sign.
Where the revenue sat
"Broad-based," in the chair's quote, is a revenue claim, and the revenue tables support it. Every geography, every industry group and both types of work grew in dollars and in local currency in the quarter. The pace was not even. Operating income did not follow revenue in Asia Pacific.
| Industry group | Revenue | Change in US dollars | Change in local currency |
|---|---|---|---|
| Communications, media and technology | $3.26 billion | 10% | 11% |
| Financial services | $3.47 billion | 5% | 6% |
| Health and public service | $3.86 billion | 8% | 9% |
| Products | $5.56 billion | 3% | 4% |
| Resources | $2.52 billion | 6% | 6% |
| Total | $18.68 billion | 6% | 7% |
Products, at $5.56 billion, was the largest group and one of the slower, up 4% in local currency. Communications, media and technology was the fastest, up 11%, on $3.26 billion. Health and public service grew 9% in local currency in the quarter, after 0% local-currency growth in the third quarter, and was the slowest group for the year, up 2%, at $15.17 billion.
Americas revenue was $9.43 billion, up 7% on both bases. EMEA was $6.58 billion, up 6% in dollars and 7% in local currency. Asia Pacific was $2.67 billion, up 3% in dollars against 7% in local currency. Over the full year the currency sign in Europe flipped: EMEA's $26.96 billion was up 9% in dollars and only 4% in local currency. Americas, $36.55 billion, was up 4% on both bases.
Consulting revenue was $9.28 billion, up 7% in local currency. Managed services was $9.40 billion, up 7%. For the year, managed services of $37.30 billion rose 6% in local currency, against 3% for consulting at $36.88 billion.
Operating income is where the wording stops. Fourth-quarter GAAP operating income in Asia Pacific was $382.4 million, against $400.0 million, margin 14% against 15%. For the year it was $1.725 billion against $1.810 billion, margin 16% against 18%. Revenue grew in Asia Pacific. Operating profit did not. In the Americas, GAAP operating income rose from $987 million to $1.616 billion, but adjusted operating income a year earlier was already $1.408 billion once a $420 million optimization add-back is included. The gain on that base is about $208 million.
Bookings, and what was not broken out
Quarterly bookings were $22.17 billion, up 4% in dollars and 5% in local currency, book-to-bill 1.2. Consulting bookings were $9.40 billion, book-to-bill 1.0. Managed services bookings were $12.77 billion, book-to-bill 1.4. For the year, bookings were $84.54 billion, up 5% in dollars and 3% in local currency, book-to-bill 1.1. Consulting was $40.86 billion. Managed services was $43.67 billion.
Sweet calls 141 quarterly client bookings of $100 million or more a new high. The exhibit does not print the old high, so that record cannot be recomputed from this document. It also prints no separate generative-AI bookings figure. The about section's scale line is about 814,000 people and about 9,000 clients.
Why 46% is the wrong rate to carry away
Gross margin was 32.0% in the quarter and in the year, against 31.9%. One tenth of a point. Fourth-quarter selling, general and administrative expenses were $3.12 billion, 16.7% of revenue, the same ratio as a year earlier.
GAAP operating margin was 15.3%, against 11.6%. The release calls that 370 basis points, and it calls operating income of $2.86 billion a 40% increase from $2.05 billion. The base is not clean. The prior quarter included $615.3 million of business-optimization costs, which the footnote describes as primarily employee severance from a programme begun in the fourth quarter of fiscal 2025 and finished in the first quarter of fiscal 2026. This year's fourth quarter shows none. Add the charge back and prior-year adjusted operating income is $2.665 billion, margin 15.1%. Against that, 15.3% is 20 basis points.
For the year, GAAP operating margin was 15.4% against 14.7%, and adjusted margin was 15.8% against 15.6%. GAAP operating income was $11.41 billion, up 12%. Adjusted was $11.71 billion, up 8%. The fiscal 2026 optimization cost was $307.5 million, booked in the first quarter. The June outlook had pointed at a GAAP margin of 15.3% and an adjusted margin of 15.8%. The year came in at 15.4% and 15.8%.
Margin was the June point, give or take a tenth.
Diluted earnings per share were $3.29, against $2.25. The release calls that 46%. On the printed figures, $3.29 is 46.2% above $2.25. Against adjusted earnings per share of $3.03, the release calls the increase 9%. $3.29 is 8.6% above $3.03, which rounds to 9% with no decimal. The 46% uses a base that includes a $0.78 charge. The 9% does not.
The bridge from adjusted $3.03 to reported $3.29 attributes $0.22 to higher revenue and operating results, $0.13 to a lower share count, $0.03 to a lower tax rate, a cost of $0.01 to higher net income attributable to noncontrolling interests, and a cost of $0.11 to lower non-operating income. The share-count piece is more than half the operating piece. Diluted weighted-average shares were 605,283,767, against 629,418,129. The GAAP tax rate was 27.3%, against 30.1%, and against an adjusted 27.9% a year earlier. Net income was $2.034 billion on the statement. Of that, $1.991 billion is attributable to Accenture plc.
For the year, GAAP diluted earnings per share were $13.56, up 12% from $12.15. Adjusted earnings per share were $13.97, up 8% from $12.93, the 8% in Sweet's quote. Of the adjusted increase, $0.33 came from a lower share count and $0.24 was given back to a higher tax rate. The June GAAP range was $13.38 to $13.50. Reported $13.56 is $0.06 over the top. The June adjusted range was $13.78 to $13.90. Reported $13.97 is $0.07 over the top. The year cleared the June earnings ranges, with a visible slice of the per-share gain coming from fewer shares.
Cash in the quarter went the other way
Fourth-quarter free cash flow fell. Operating cash flow was $3.10 billion, against $3.91 billion. Additions to property and equipment were $0.25 billion, against $0.11 billion. Free cash flow was $2.85 billion, against $3.81 billion. Days services outstanding were 50 at 31 August, against 47. Cash was $12.8 billion, against $11.5 billion. For the year, free cash flow was $11.62 billion, against $10.87 billion, just above a June range of $10.8 billion to $11.5 billion. The year was the cash year.
RelatedBlackstone (BX) Falls 6.7% in the Five Sessions to 19 Oct
The quarter was not.
Cash returned in the year was $11.5 billion, which the release calls a record and a 38% increase: $7.5 billion of repurchases and redemptions, and about $4.0 billion of dividends. Dividend payments were $3.99 billion, against $3.70 billion. On 14 August a quarterly dividend of $1.63 was paid to holders of record on 9 July, $974 million for that instalment. The board has declared $1.71 a share, record date Tuesday 13 October 2026, payable Friday 13 November 2026. The release calls that a 5% increase on the fiscal 2026 quarterly rate. $1.71 is 4.9% above $1.63, which rounds to 5%.
Four times $1.71 is $6.84. On the $212.30 close that run-rate is a 3.22% yield, and it is arithmetic: three further dividends at $1.71 have not been declared. The June release had called $1.63 a 10% step up from $1.48 in fiscal 2025. This step is 5%.
In the fourth quarter the company repurchased or redeemed 17.6 million shares for $2.3 billion, mostly in the open market. For the year, 39.9 million shares for $7.5 billion, including 37.5 million in the open market. Remaining authority is about $6.9 billion, including $6.0 billion the board added in September. Shares outstanding were about 596 million at 31 August, against about 612 million at 31 May.
On that 31 August count, which is not a 1 October count, $212.30 implies a market value near $126.5 billion, and the $28.93 move is about $17.2 billion. If the count changed in September, both figures move. The exhibit does not give a September count.
The ranges for fiscal 2027
First-quarter revenue is guided at $18.95 billion to $19.60 billion, local-currency growth 2% to 6%, foreign exchange about a 1% headwind. For the year, local-currency revenue growth is 3% to 6%, with foreign exchange flat. Operating margin is 15.9% to 16.1%: 50 to 70 basis points over the 15.4% GAAP margin, and only 10 to 30 basis points over the 15.8% adjusted margin. The tax range is 24.5% to 26.5%, around last year's 25.1% GAAP rate and 24.9% adjusted rate.
Diluted earnings per share are guided at $14.39 to $14.81, a 6% to 9% increase over GAAP $13.56 and a 3% to 6% increase over adjusted $13.97. Operating cash flow is $11.9 billion to $12.7 billion, against $12.36 billion just reported. Property and equipment additions are $900 million, against $0.74 billion. Free cash flow is $11.0 billion to $11.8 billion, against $11.62 billion. The cash ranges straddle the year just finished.
Capital to be returned is at least $9.5 billion. The floor is $2.0 billion under the $11.5 billion returned in fiscal 2026. "At least" means the floor is not a ceiling. It is also not a statement that last year's return will be matched.
A 15.78% day is larger than the top of that full-year earnings guide, and the close was still 6.73% under the high. This is not a forecast, and the chart has no scenario lines.
Other results days on this desk
A results day does not carry a sign. On Wednesday, Jabil fell 10.03% to $286.86 after its own fiscal fourth-quarter beat, with revenue of $10.6 billion, as reported in Jabil (JBL) Falls 10% After a Fiscal Q4 Earnings Beat. Accenture went the other way.
A rise can still leave a share under an earlier high. Costco rose 2.93% to $922.77 after its fourth quarter and remained 15.8% under its May high, the point of Costco (COST) Rose 2.9% After Q4 Yet Sits 15.8% Below May High. Accenture finished Thursday 26.4% under its 14 January close. Up on the day is not the same thing as back at the high.
Heavy volume is not a verdict by itself. Lennar closed at $76.43 on 18 September, a 52-week low on about 3.5 times average volume, in Lennar Made a 52-Week Low of $76.43 on 3.5x Normal Volume. Accenture's Thursday was 5.44 times its preceding 20-session average. The 18 June session was 8.38 times its own, and the price fell.
Dates already printed
The next dates in the release are the dividend record date of 13 October 2026 and the payment date of 13 November 2026. The first-quarter range covers the quarter after 31 August. The release does not name the day that quarter will be reported.
The exhibit also warns that AI work may fail to pay off, or may reduce demand for existing services.
This is analysis, not a recommendation. Capital is at risk. The figures come from Accenture's Exhibit 99.1 to the Form 8-K accepted on 1 October 2026, the third-quarter exhibit dated 18 June 2026, and Nasdaq daily prices retrieved on 2 October 2026 at 07:33 UTC. The quote page was not a live tick, and the US cash session of 2 October had not opened. Nothing here is a trading instruction.