

MaxLinear (MXL) closed at $93.70 on 8 October 2026, down $13.66 from the $107.36 close on 7 October. That is a fall of 12.72%, the figure the headline rounds to 12.7%. The session opened at $103.18, already 3.9% under the prior close, tagged $105.00, and sold through to a low of $93.21, finishing within fifty cents of it. Volume was 3,996,883 shares, about 1.25 times the 3,199,716-share average of the prior 20 sessions. No new results release was in the SEC feed. The next company numbers are the 22 October call. By Friday the close was $96.16, so the hole from 7 October over two sessions was 10.4%, not the whole Thursday loss. The market had been shut since Friday's 4:00 p.m. EDT close when these prices were pulled on 11 October.
The percentage reads like a MaxLinear story. Scaled to the semiconductor basket, it reads like the stock's own beta. The iShares Semiconductor ETF, SOXX, fell 3.35% the same day, from $582.82 to $563.28. MaxLinear's beta on the statistics page is 3.94. A 3.35% basket move times 3.94 is about 13.2%, and the shares fell 12.7%. The fit breaks the next session. On 9 October MaxLinear stock rose 2.63%, to $96.16, while SOXX slipped a further 0.7% to $559.40. Thursday matched the basket. Friday did not. Under both prints sits the move the headline leaves out: the 29 July close was $57.25, and the 7 October close of $107.36 stood 87.5% above it.
The heavier print this month was an up day.
Key facts
- MaxLinear closed at $93.70 on 8 October 2026, down 12.72% from the $107.36 close on 7 October — StockAnalysis daily history, retrieved 11 October 2026.
- The 9 October close was $96.16, up 2.63% on the day and 10.4% below the 7 October close, after a session low of $91.65 — StockAnalysis daily history, retrieved 11 October 2026.
- Market cap was $8.72 billion at that Friday close, on trailing revenue of $568.93 million and a trailing net loss of $103.76 million — StockAnalysis statistics, S&P Global Market Intelligence, retrieved 11 October 2026.
- Second-quarter 2026 net revenue was $168.8 million, up 55% year on year, and the third-quarter revenue outlook was $210 million to $220 million — MaxLinear exhibit 99.1, furnished with the Form 8-K filed 23 July 2026.
- SOXX fell 3.35% on 8 October, from $582.82 to $563.28, beside a MaxLinear beta of 3.94 — StockAnalysis history for SOXX and the MaxLinear statistics page, retrieved 11 October 2026.
- Reported short interest was 4.89 million shares, 5.39% of shares outstanding, with 1.68 days to cover — StockAnalysis statistics, retrieved 11 October 2026.
A $13.66 session, on ordinary volume
Split Thursday into the gap and the cash session and the shape changes. From $107.36 to the open at $103.18 is 3.9%. From that open to the $93.70 close is another 9.2%. The high at $105.00 never reclaimed the prior close, and the close sat on the $93.21 low.
Volume does not match the percentage. Those 3.997 million shares were only a quarter above the 20-day average. On 2 October the stock rose 14.99%, closed at $105.93, and traded 4,790,159 shares, a heavier tape than the decline. Institutions hold 83.29% of the company and insiders 5.87%, on the same statistics page. Shares sold short were 4.89 million, against 4.84 million the prior month: 5.39% of shares outstanding, 5.74% of the float, 1.68 days to cover. The day was not a squeeze, and it was not a new wave of short sales in the latest reported figure.
A deeper hole is on the chart, and it is a different event. The second-quarter release is dated 23 July. The close that day was $91.24. The next session closed at $71.59, a 21.5% fall. By 29 July the close was $57.25, 37.3% under the release-day close. The SEC list shows that 23 July 8-K and the 10-Q, then ownership filings, not a second results release, before month-end. This piece does not invent a motive for the July slide. The company document on the record is the earnings release. The sourced group event for 8 October is the one below.
A double-digit day in a hardware name is not, by itself, a MaxLinear signature. Jabil's decline after its fiscal fourth quarter was a different company and a different reason. The comparison that holds is the shape: a large percentage, then the question of whether the percentage was the business or the tape. On 8 October MaxLinear's business did not publish a new number.
The $20 billion gap the outlets actually described
On 9 October, Mark Sweney at the Guardian reported that OpenAI had told investors revenue this year would reach $50 billion, based on sales through the end of September, against a $70 billion figure signalled the previous month. He wrote that the $20 billion gap had buffeted US tech stocks on Thursday. The discrepancy, on his account, came from comparing OpenAI with Anthropic. Anthropic counts sales through cloud partners. OpenAI does not. Anthropic, he reported, had reached $65 billion of forecast revenue by the end of July.
Daniel Howley, technology editor at Yahoo Finance, had published at 17:40 UTC on 8 October, citing the Financial Times. He put September annualised revenue near $50 billion and described the $70 billion as an investor calculation: a rough $40 billion August base, plus a comment that revenue had grown 70%. The Financial Times page itself returned an access block on 11 October, so this article does not pretend to have read the primary document. It stands on the two reports that were open.
The accounts agree on the gap that hit the tape, $50 billion against $70 billion, and on an accounting mismatch with Anthropic. They do not quite agree on what the $70 billion was. The Guardian calls it a figure OpenAI had signalled. Yahoo, citing the Financial Times, calls it a reconstruction. That distinction matters, because a company cutting its own number is a different fact from investors having added a growth rate to a base they were not supposed to add. Either way, chip stocks were the instrument the discrepancy was marked in.
The revenue argument landed on a private company whose spending plans have been used, all year, as a reason to pay up for the silicon around it.
MaxLinear is not a chatbot company. It designs communications silicon. The July release points the growth language at optical links inside data centers. A lower OpenAI revenue number reaches this share price only along a chain: less confidence in AI infrastructure spend, less confidence in 800-gigabit and 1.6-terabit optical ramps, a lower price for a supplier that has been talking about those ramps. The chain is how the group traded on the 8th. It is not a disclosed lost order. None was filed.
Where the close sits on the chart
From 1 June to 9 October the closes show a June spike, a July air pocket, a base, and the climb Thursday cut into. The 30 June high was $128.30 and the close was $128.03, the peak of this series. The 9 October close of $96.16 is 24.9% under that June close, and 502% above the $15.96 close on 9 October 2025. Both distances are real.
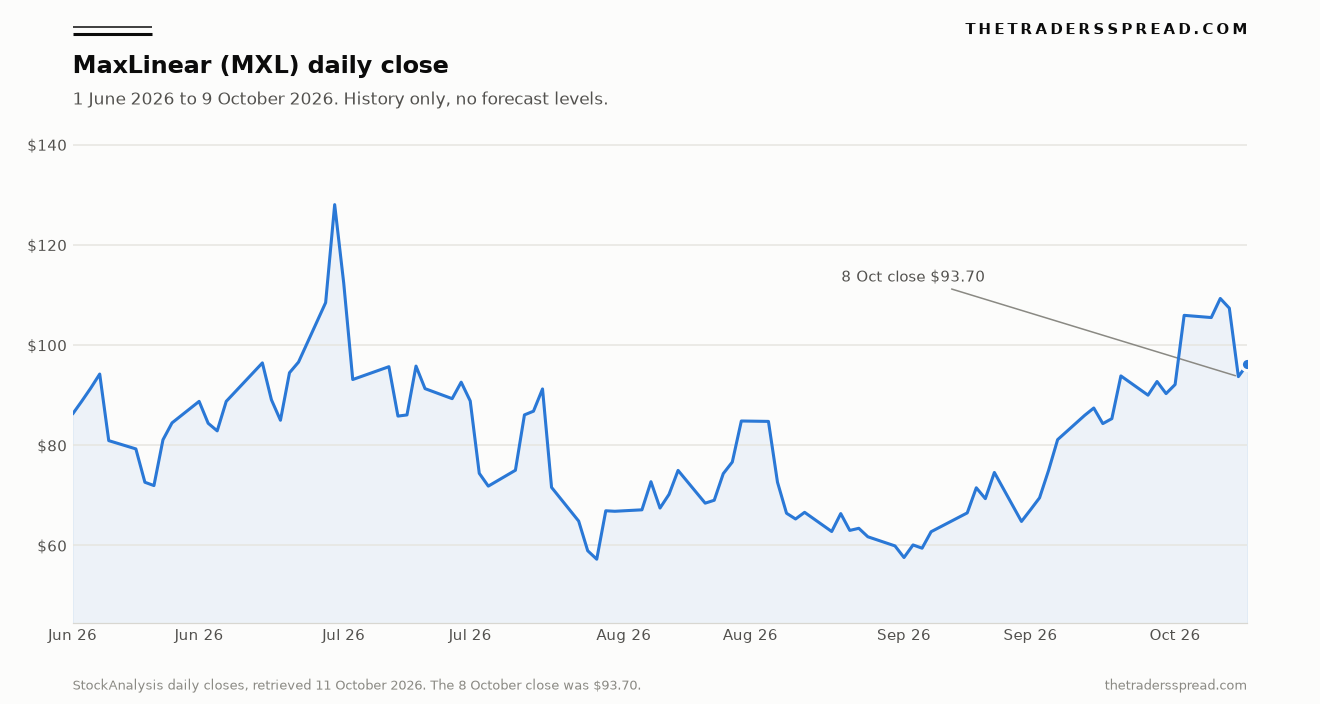
Thursday was the wide end of a move optical and connectivity names shared. The closes below are from the same history pull on 11 October. The last column is Friday, so a bounce has to show up as a number rather than as a hope.
| Name | 7 Oct close | 8 Oct close | 8 Oct change | 9 Oct close |
|---|---|---|---|---|
| MaxLinear (MXL) | $107.36 | $93.70 | -12.7% | $96.16 |
| Coherent (COHR) | $334.56 | $302.35 | -9.6% | $312.62 |
| Astera Labs (ALAB) | $382.25 | $347.05 | -9.2% | $342.21 |
| Ciena (CIEN) | $446.45 | $425.93 | -4.6% | $449.77 |
| Broadcom (AVGO) | $376.51 | $360.14 | -4.3% | $361.54 |
| Credo (CRDO) | $220.01 | $211.86 | -3.7% | $216.55 |
| Marvell (MRVL) | $284.68 | $274.66 | -3.5% | $275.28 |
| SOXX | $582.82 | $563.28 | -3.4% | $559.40 |
Astera Labs fell again on Friday, so its two-day move from 7 October was about 10.5%, in line with MaxLinear's 10.4%, even though Thursday itself was smaller. Ciena closed Friday at $449.77, above its 7 October close. SOXX did not bounce. It finished at $559.40, 4.0% under the 7 October close. MaxLinear's Friday rise was a divergence from the ETF, not a drift with it.
The averages were not retaken from below, because the price never reached them. At $96.16 the Friday close was still 25.7% above the 50-day average of $76.50 and 72.5% above the 200-day of $55.74. Relative strength was 57.3. A 12.7% day off the 7 October close of $107.36 can be violent and still leave both averages well under the market.
The contract-manufacturing end of the same spending sits in another note. Celestica's forecast piece is about a builder of AI systems, not a PAM4 DSP. One revenue scare at a model lab gets marked across several layers at once. On the 8th MaxLinear's layer was marked harder than Broadcom, Credo, Marvell, or the ETF.
What Carlsbad last put in a filing
MaxLinear, Inc. designs communications chips from Carlsbad, California. It was founded in 2003 and listed on Nasdaq on 24 March 2010. The profile address is 5966 La Place Court, Suite 100. Kishore Seendripu is chairman and chief executive. Steven G. Litchfield, chief financial officer and chief corporate strategy officer, signed the 23 July Form 8-K. Headcount on the statistics page is 1,115. The catalogue runs from radio-frequency and mixed-signal parts through cable access and into optical links.
The 23 July release is the last full quarter. Net revenue was $168.8 million, up 23% on the prior quarter and 55% on the year. GAAP gross margin was 57.8%. GAAP operating margin was negative 2.5%. GAAP diluted earnings were $0.02 a share. Non-GAAP operating margin was 22.3%, and non-GAAP diluted earnings were $0.35. The release prints both pairs. They are not one result with two labels.
The quarterly series shows how GAAP earnings could be positive while operations were not. Pretax income was a loss of $6.55 million. The tax line was a benefit of $8.31 million. Net income was $1.76 million, and operating income was a loss of $4.12 million. The $0.02 was a tax outcome on a pretax loss. Trailing twelve-month net income was still a loss of $103.76 million, and trailing free cash flow was $3.31 million. On an $8.72 billion market cap the page's price to free cash flow is 2,636. The equity is priced on the ramp being described, not on cash already in the account.
Seendripu tied that ramp to a named chip. "The strong momentum in our optical AI data center business reflects the ramp of our Keystone PAM4 DSP platform for 800G applications, as well as the strength of our expanding infrastructure portfolio and roadmap for 1.6T- capable products," he said. Infrastructure revenue, the data-center line, grew 145% year on year. The summary does not give a dollar split against broadband. This article will not guess one.
He also said the company was in a position "to deliver sustained growth, expanding profitability, and long-term value for our shareholders." Next to a negative 2.5% GAAP operating margin, that is a claim about direction, not a description of the GAAP year. Revenue was $1.12 billion in 2022 and $125 million of earnings. It fell to $361 million in 2024, with a $245 million loss, then recovered to $468 million in 2025, still with a $137 million loss. Trailing revenue of $569 million is about half the 2022 peak.
The third-quarter outlook in that same release is the bar for 22 October: revenue of $210 million to $220 million, GAAP gross margin of 57% to 60%, and a fully diluted share count of 99 million. The midpoint, $215 million, would be 27% above the $168.8 million just printed. Basic shares in the June quarter were 90.0 million, up 2.8% from 87.6 million in March. Diluted shares jumped to 97.3 million, an 11.1% increase, because a profitable quarter counts instruments that a loss quarter leaves out. Shares outstanding, 90.69 million, sit near the basic count.
Two earlier notices, from Business Wire via the StockAnalysis news list, belong to the other half of the catalogue. Puma 9, a DOCSIS 4.0 cable chip, was launched on 28 September. Topaz, a passive-optical gateway chip, was introduced on 6 October, and the close that day was $109.30, up 3.61%. The 1 October notice set the call for 22 October at 1:30 p.m. Pacific. A cable gateway and an 800G DSP do not share a purchase order. For the valuation, they were traded as one story: the price-to-sales ratio on trailing revenue is 15.33, and the forward price-to-earnings ratio on the statistics page is 41.23. Those are multiples, not a destination for the share price.
RelatedCelestica Stock Forecast (CLS): $520 Bull, $280 Bear
Cash was $64.81 million and debt was $148.20 million, so net debt was about $83 million. The Altman Z-score on the page is 4.41. Thursday was an argument about the multiple on future optical revenue, not about the cash balance.
What this changes
Thursday changes the reference price. It does not move the next company fact. The September quarter is reported on 22 October, at the hour set on 1 October, and it will be read against the July outlook of $210 million to $220 million. A print inside that range, above it, or under it is information the 8 October session did not contain. Until then, another down day in SOXX can still produce an outsized MaxLinear move because the beta is 3.94. Thursday showed the arithmetic. Friday showed its limit: the stock rose while the ETF fell.
The chart was not washed out. A $96.16 close, about 26% above the 50-day and about 72% above the 200-day, with relative strength at 57, is not a cleared book. The 87.5% advance from the 29 July close of $57.25 to 7 October is still mostly in the price. So is the memory of 24 July, when the stock fell 21.5% in a session and later rallied anyway. One Thursday does not settle a name that has already done larger violence in both directions this quarter.
Three windows, not one. From the 7 October close to the 8 October close, down 12.7%. From the 7 October close to the 9 October close, down 10.4%. From the 7 October close to Friday's $91.65 low, down 14.6%, a drawdown the Friday close then cut back. Anyone quoting a single figure is choosing a window. The history file supports all three. It does not make them interchangeable.
What would make the next move about MaxLinear, rather than about a private company's revenue accounting, is a number Carlsbad prints: sales against $210 million to $220 million, and whether infrastructure growth still resembles the 145% reported for June. A result inside that range does not restore the $107.36 close. This desk has used a bull-and-bear frame on ON Semiconductor. There is no share-price level in this note.
Questions the tape leaves open
Why did MaxLinear fall on 8 October 2026?
The shares fell 12.72% that session, from $107.36 to $93.70, and the SEC list shows no new MaxLinear results release that week. The Guardian, and Yahoo Finance citing the Financial Times, tied Thursday's chip weakness to reports that OpenAI's revenue was near $50 billion rather than a $70 billion figure in circulation. MaxLinear's drop was about its 3.94 beta times SOXX, which fell 3.35% the same day.
How is the 12.7% calculated, and what about Friday?
Take the 8 October close off the 7 October close and divide by the 7 October close. $93.70 minus $107.36, divided by $107.36, is negative 12.72%, which rounds to 12.7%. Friday 9 October closed at $96.16, up 2.63% from Thursday and 10.4% below the 7 October close. Friday's low of $91.65 undercut Thursday's low. The session and the two-day window are different statistics.
What does MaxLinear make, and is OpenAI a customer?
The company supplies radio-frequency, analog, mixed-signal and digital communications chips, including cable and fibre access parts and optical DSP silicon. The July release named the Keystone PAM4 DSP for 800G links and a roadmap toward 1.6T. Nothing in the 8 October record identifies OpenAI as a MaxLinear customer. The link that day ran through AI infrastructure spending, not through a disclosed order.
When is the next report, and what revenue range is on the page?
A Business Wire notice dated 1 October 2026 set the third-quarter call for 22 October at 1:30 p.m. Pacific Time. The revenue outlook still standing from the 23 July release is $210 million to $220 million, against second-quarter revenue of $168.8 million. The midpoint would be a 27% sequential increase. That range is a company outlook for sales, not a level for the share price.
Did 8 October break the 50-day or 200-day average?
No. At the 9 October close of $96.16 the shares were 25.7% above the 50-day average of $76.50 and 72.5% above the 200-day of $55.74, on statistics retrieved 11 October 2026. Relative strength was 57.3. Thursday was a large down day from an extended price. Both averages sit well under the close, so neither was tested.
Was the July drop bigger?
Yes. The close on 23 July, the day of the second-quarter release, was $91.24. The 24 July close was $71.59, down 21.5%, and the 29 July close was $57.25. This article does not assign a cause to that slide. It is on the chart so Thursday's 12.7% is not mistaken for the largest break of the past few months. The rally from that July close to 7 October was 87.5%.
Disclaimer
This is market analysis for information, not a recommendation and not a solicitation to deal in MaxLinear or any other security. Prices, filings and press reports can be revised after publication. Capital is at risk. Figures above are taken from the sources and dates named in the text, pulled on 11 October 2026, after the regular session had been closed since the 9 October bell.