

The Milwaukee Brewers are 97-58, the best record in Major League Baseball, on a run differential of +199, also the best in Major League Baseball. Polymarket's 2026 World Series board prices them at 15.0%. The Los Angeles Dodgers sit a game and a half behind Milwaukee in the standings and eight runs behind in differential, and the same board prices them at 30.5%. Both numbers were live at 07:36 UTC on 20 September, seven days before the regular season ends and eight before the postseason begins. One of those two prices is wrong, and the interesting part is that the wrongness is measurable rather than a matter of taste. Every input needed to check it sits in a public, keyless data feed run by the league itself, and none of it requires a subscription, a scraper or a paid projection system.
Here is the measurement. MLB's own standings API publishes an expected won-lost record for every club, derived from runs scored and runs allowed. Read at 07:37 UTC on 20 September 2026, it returns 97-58 for Milwaukee and 97-58 for Los Angeles. Identical, to the game. The market is asking traders to accept that two clubs with the same expected record, in the same league, both holding a first-round bye, differ by a factor of two in their chance of winning four rounds. We rebuilt the bracket 200,000 times to find out what that factor should be. It came out at 0.94, with Milwaukee in front. Links to Polymarket are affiliate links, from which The Traders Spread may earn a commission at no cost to you, and the board discussed here is the MLB World Series Champion 2026 market.
Key facts
- Milwaukee 97-58, run differential +199; Los Angeles 95-60, +191 — MLB statsapi standings, read 20 Sep 2026 07:37 UTC.
- MLB's own Pythagorean expected record: Milwaukee 97-58, Los Angeles 97-58, identical — MLB statsapi
expectedRecords, 20 Sep 2026. - Polymarket mid-prices: Brewers 15.0% (bid 14.7 / ask 15.3), Dodgers 30.5% (bid 30.0 / ask 31.0) — gamma-api, 20 Sep 2026 07:36 UTC.
- The eighteen live legs sum to 103.8%, so the board carries 3.8 points of overround — Polymarket gamma-api, 20 Sep 2026.
- Our fair value: Brewers 21.5%, Dodgers 20.3%, from 200,000 simulated finishes and brackets.
- Milwaukee's bullpen ERA is 3.45, fourth in MLB; the Dodgers' is 3.93, fourteenth — MLB statsapi team pitching splits, 20 Sep 2026.
- The Brewers leg has traded $1,561,743 against the Dodgers leg's $495,489, on near-identical resting liquidity of about $107,000 each — gamma-api per-market figures, 20 Sep 2026.
A board with twelve dead legs and 3.8 points of overround
Thirty-one markets hang off the event. Twelve are already closed and printing zero: Detroit, Kansas City, the Angels, the Athletics, the Mets, Miami, Washington, St. Louis, Cincinnati, Pittsburgh, San Francisco and Colorado, each resolved to No the moment elimination became arithmetic. A thirteenth leg, "Other", shows a bid of 0 and an ask of 1, which is a polite way of saying nobody has quoted it.
That leaves eighteen tradeable legs. Summed at the mid, they come to 103.8%. The overround is modest by sportsbook standards and wide by the standards of a market that has turned over $40.8m, and it matters for this exercise because a raw comparison of model output against raw market prices flatters the model on every leg. Normalising the board to 100% puts the Brewers at 14.45% and the Dodgers at 29.38%. The gap survives the adjustment in both directions.
Detroit is worth a second look before moving on. The Tigers outscored their opponents by 75 runs this season, a better differential than the Tampa Bay Rays, who clinched the American League East. Detroit's leg is closed at zero. The Texas Rangers, who have been outscored by 29 runs, lead the American League West and trade at 2.8%. Nothing about that is a pricing error. It is a reminder that this board pays on bracket position and four short series, not on season-long quality, and any fair value that ignores the bracket is decoration.
Where the fair value comes from
The model has four moving parts, and all four are deliberately boring.
Team strength starts from Pythagenpat rather than won-lost record. Each club's runs scored and runs allowed produce an expected winning percentage using an exponent set by its own run environment, which is the standard refinement over the fixed 1.83 exponent. Milwaukee lands at .631, Los Angeles at .629, the Yankees at .600, the Cubs at .591, Atlanta at .582, Boston at .560, Tampa Bay at .555. Those seven are the only clubs in the field above .550.
Second, the estimates are shrunk toward .500. A single season of run differential is a noisy read on talent, so the model multiplies each club's distance from .500 by 0.70 before simulating. Milwaukee's .631 becomes .592 in the engine; the Dodgers' .629 becomes .590. Shrinkage is the assumption most likely to be argued with, so the whole thing was re-run at 0.50 and at 1.00 as well.
Third, the remaining regular season is simulated game by game. MLB's schedule feed returns 106 unplayed games between 20 and 27 September, seven for most clubs and eight for the Yankees and the Rays. Each is resolved with a log5 matchup probability adjusted for home advantage at the league's long-run .535 home win rate. Division winners, wild cards and seeds fall out of the simulated final standings.
Fourth, the bracket plays out under the twelve-team format: byes for the top two division winners, the third seed hosting the sixth and the fourth hosting the fifth in best-of-three, then best-of-five and two rounds of best-of-seven, with home advantage to the better record. Two hundred thousand seasons took about ninety seconds to run.
What the model does not know is its own boundary. It has no injury list, no starting-rotation ordering, no read on which arm is available on short rest. It treats a club as one number. Anyone arguing that the Dodgers deserve their premium is arguing precisely from what the model leaves out, and that argument deserves to be priced rather than waved away. We price it below.
Market price against fair value
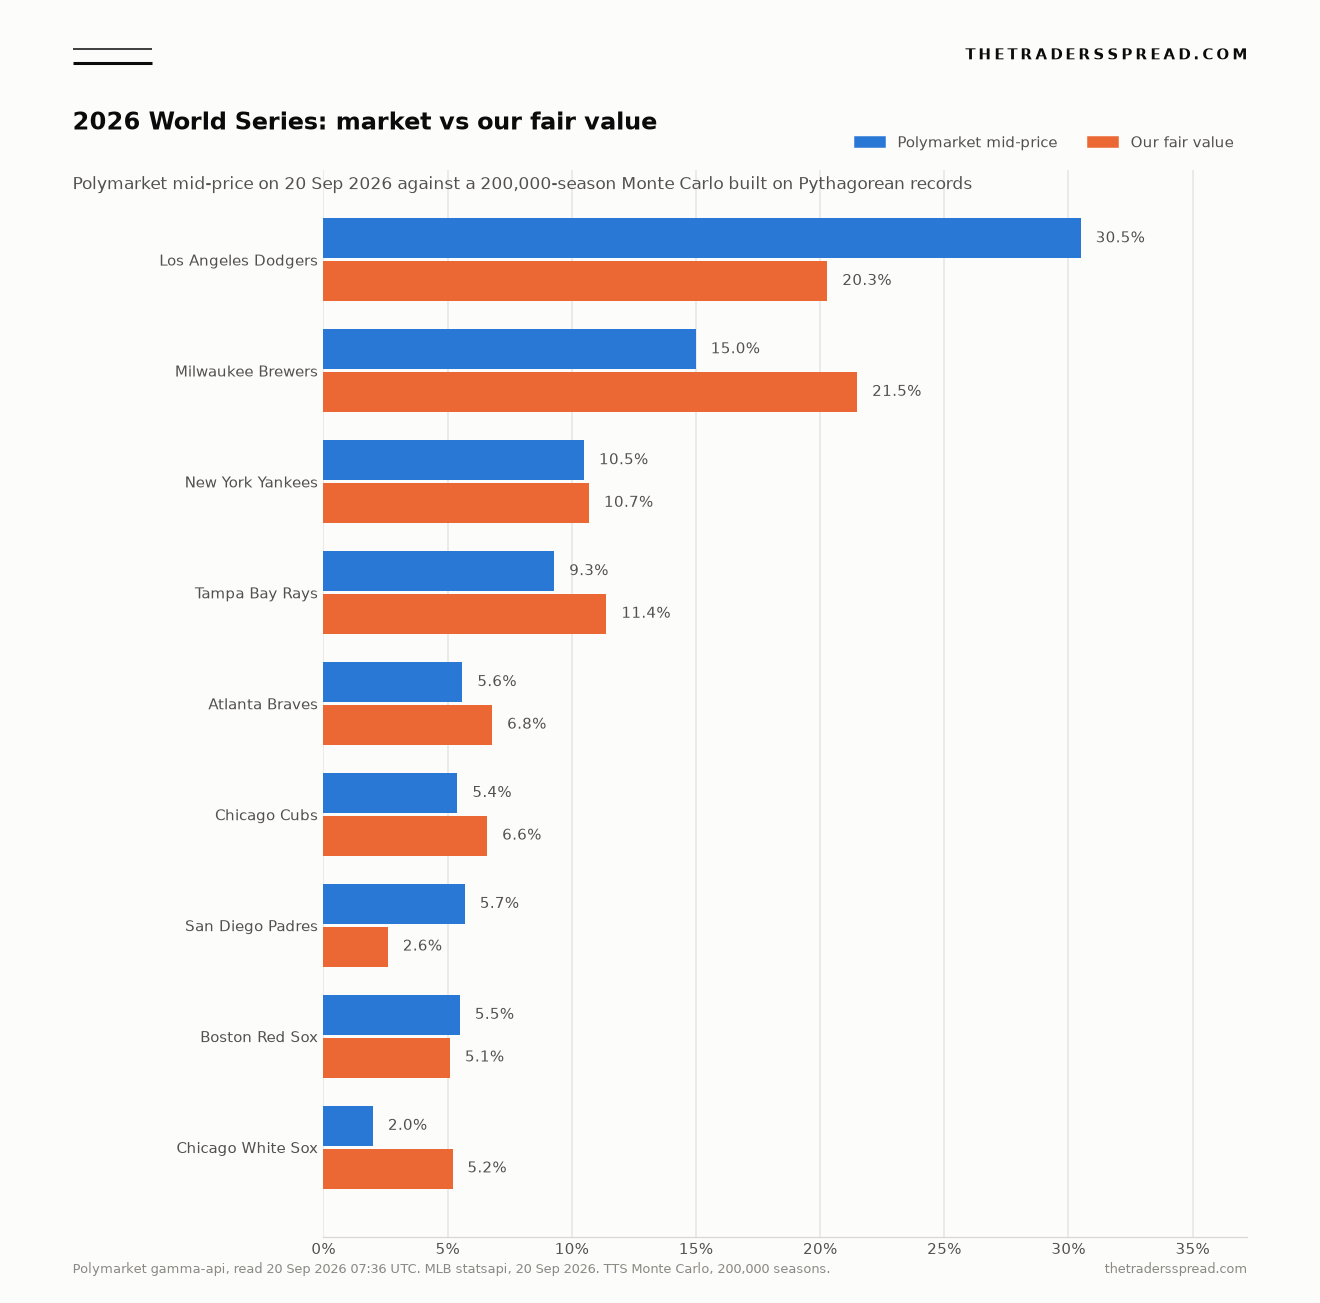
Nine legs carry the story. The two biggest gaps run in opposite directions and both sit in the National League.
| Team | Polymarket mid | Devigged | Our fair value | Gap vs devigged | Leg volume |
|---|---|---|---|---|---|
| Los Angeles Dodgers | 30.5% | 29.4% | 20.3% | -9.1 pts | $495,489 |
| Milwaukee Brewers | 15.0% | 14.5% | 21.5% | +7.0 pts | $1,561,743 |
| New York Yankees | 10.5% | 10.1% | 10.7% | +0.6 pts | $471,554 |
| Tampa Bay Rays | 9.25% | 8.9% | 11.4% | +2.5 pts | $477,265 |
| Atlanta Braves | 5.6% | 5.4% | 6.8% | +1.4 pts | $1,222,339 |
| Chicago Cubs | 5.4% | 5.2% | 6.6% | +1.4 pts | $1,385,206 |
| San Diego Padres | 5.65% | 5.4% | 2.6% | -2.8 pts | $1,456,955 |
| Boston Red Sox | 5.45% | 5.3% | 5.1% | -0.2 pts | $2,269,152 |
| Chicago White Sox | 2.0% | 1.9% | 5.2% | +3.3 pts | $2,649,944 |
Milwaukee wins the National League pennant in 33.6% of simulations and the World Series in 21.5%. Los Angeles takes the pennant in 32.1% and the title in 20.3%. The Brewers hold the number one seed in 83.6% of runs, which is worth a fraction of a percentage point rather than a dramatic edge, because the difference between the one and two seeds under this format is a marginally easier Division Series opponent and home advantage in a League Championship Series that both clubs reach less than half the time.
Sensitivity to the shrinkage factor is mild. At 0.50 the Brewers come out at 19.2% and the Dodgers at 18.4%. At 1.00, which is to say taking run differential entirely at face value, the Brewers reach 24.6% and the Dodgers 23.4%. Milwaukee finishes ahead of Los Angeles at every setting tested, and the Milwaukee number never falls below 19%. The market's 15.0% sits outside that entire range.
Pricing the Dodgers premium instead of dismissing it
The honest case for the Dodgers is a rotation case, and it is a good one. A short series compresses innings into three or four starters, so a club whose top of the rotation is far better than its fifth and sixth options gains more in October than a 162-game run differential can capture. Los Angeles has exactly that shape. Yoshinobu Yamamoto has thrown 179 innings at a 2.51 ERA with a 0.87 WHIP. Tarik Skubal, since joining the club, has made sixteen starts at 2.79. Tyler Glasnow has twelve starts at 3.46. The Dodgers' aggregate starter ERA of 3.45 ranks second in MLB behind the Yankees.
Milwaukee's rotation is one arm and then a queue. Jacob Misiorowski has been the best starting pitcher in baseball this season by a distance: 28 starts, a 1.89 ERA, 243 strikeouts in 166.1 innings, a 0.81 WHIP. Behind him, Dustin May sits at 4.38 in a Brewers uniform, Kyle Harrison at 4.25, Robert Gasser at 4.01, Shane Drohan at 4.26. The staff ERA of 3.65 ranks fifth, and it is held up at one end.
So the market's story is coherent. The question is what it is worth, and that can be solved for directly. We re-ran the simulation adding a flat bonus to Los Angeles's true-talent winning percentage, and searched for the bonus that reproduces the board's 2.03-to-one ratio between the two legs.
The answer is +0.058, which over a 162-game season is 9.4 wins. To justify the current prices, a trader has to believe that the Dodgers' postseason talent exceeds their full-season run differential by more than nine wins, that Milwaukee gets no comparable adjustment, and that both propositions hold after 155 games of evidence. That is a large belief to hold quietly inside a 15-point price gap.
There is also a mirror to the rotation argument that the premium ignores. Postseason baseball shifts innings away from starters and toward relievers, and Milwaukee's bullpen ERA of 3.45 ranks fourth in MLB while the Dodgers' 3.93 ranks fourteenth. Trevor Megill has 28 saves at 2.76, Abner Uribe a 2.04 ERA with 22 holds, DL Hall a 2.09. Milwaukee converted 50 saves against 20 blown; Los Angeles converted 43 against 22. If the reason to pay up for the Dodgers is that October redistributes innings, the redistribution does not run only one way.
Two further splits cut against the premium. Milwaukee is 43-29 against clubs with winning records, a .597 clip; Los Angeles is 37-35, or .514. And Milwaukee is 52-26 at home against the Dodgers' 49-28, which matters given that the Brewers hold home advantage through the National League bracket in five simulations out of six.
| Component | Milwaukee Brewers | Los Angeles Dodgers |
|---|---|---|
| Record | 97-58 | 95-60 |
| Run differential | +199 | +191 |
| MLB expected record | 97-58 | 97-58 |
| Starter ERA (MLB rank) | 3.65 (5th) | 3.45 (2nd) |
| Reliever ERA (MLB rank) | 3.45 (4th) | 3.93 (14th) |
| Team OPS (MLB rank) | .744 (4th) | .764 (2nd) |
| Record vs winning clubs | 43-29 | 37-35 |
| Home record | 52-26 | 49-28 |
| Saves / blown saves | 50 / 20 | 43 / 22 |
| Polymarket mid, 20 Sep | 15.0% | 30.5% |
The legs the model likes that nobody is trading
Three smaller dislocations are worth recording. Each also has a liquidity problem the headline pair does not.
The Chicago White Sox are 79-76, a game behind Cleveland in the American League Central, and currently hold the third wild card. The model gives them 5.2% against a 2.0% mid, the largest proportional gap on the board. That is less exciting than it looks. A leg trading at two cents on roughly $128,000 of resting liquidity cannot absorb size, and the model's affection for Chicago is an artefact of a +35 run differential meeting a very flat American League. Cleveland at 3.3% against 4.7% fair is the same trade with the same constraint.
The Tampa Bay Rays are the opposite case and the most interesting team on the board. They are 94-60 with a +79 differential, which means they have outperformed their own expected record by nine games. MLB's feed puts their expected mark at 85-69. A model built on run differential should therefore mark them down, and ours does, from a .610 actual winning percentage to a .555 Pythagenpat figure. It still produces 11.4% against a 9.25% price, because the American League bye is worth more than the market allows when the rest of the league is this compressed. Texas leads a division at 78-77.
San Diego runs the other way. The Padres are 86-69 but only +37, on a .526 Pythagenpat reading, and they are likely to enter as a wild card without a bye. The model gives them 2.6% against 5.65%. The full board is visible on the Polymarket event page, where the per-leg volume figures tell their own story: the Padres leg has turned over almost three times the Dodgers leg.
The call: 21% fair against a 15.0% offer
Our fair value on the Milwaukee Brewers leg of the 2026 World Series board is 21%. The market's offer at 07:36 UTC on 20 September was 15.3 with a 14.7 bid, a mid of 15.0, and a devigged 14.45. The market trades below our estimate by roughly six and a half points, which is why this is scored as a yes-side mispricing rather than a market in line.
RelatedPutin Out by New Year: The 2026 Leg Trades at 3.15%
The base case, at 55% of the distribution, is the one the simulation produces directly: Milwaukee finishes with the best record in baseball, takes the National League's top seed and a bye, and the price converges toward the high teens or low twenties as the bracket sets on 28 September. That convergence is the mechanism, not a Milwaukee championship.
The bull case, around 25%, is that Cleveland or Chicago wins the American League Central at 81-81 and the eventual American League representative arrives with a sub-.520 true-talent profile, which lifts the World Series conditional for whichever National League club reaches it. Milwaukee's pennant probability of 33.6% is the number that matters here, and it is already the highest on the board.
The bear case, around 20%, is that the rotation argument is simply right, that a three-man postseason staff is worth more than nine wins a season, and that the fair gap between these clubs is genuinely two to one. Even under that assumption the Brewers price out at 17.5%, still above the current offer. To get Milwaukee below 15.0% the Dodgers premium has to be larger than the market itself is charging.
What would change my mind: Misiorowski missing a start between now and 27 September, which would remove the single largest piece of Milwaukee's edge and is invisible to a run-differential model; Milwaukee losing the National League Central tiebreak scenarios and dropping to the two seed, which the simulation currently puts at 16.4%; or a Cleveland collapse that hands the American League Central to Chicago and reshapes the American League bracket in a way the current standings do not anticipate. The market resolves on 31 October 2026 per the rules published with the event, which name MLB's official information as the primary source and permit a consensus of credible reporting as a fallback.
The desk has run the same exercise on an NFL futures board, on a motorsport title market and on an individual football award. The White Sox liquidity problem mirrors a thin political nomination book, and the overround arithmetic follows the Nobel board method.
Frequently asked questions
Why use run differential rather than won-lost record?
Won-lost record includes the sequencing of runs, which does not repeat. Run differential predicts a club's next hundred games better than its own record does, which is why MLB publishes an expected record alongside the real one. In this case the two clubs' actual records differ by a game and a half and their expected records do not differ at all, so the choice of estimator is the entire disagreement with the market.
Does the model account for the Dodgers' starting pitching?
Not directly. It treats each club as a single strength number drawn from runs scored and allowed. Rather than assert that rotation shape does not matter, we solved for how much it would have to matter: a bonus of 0.058 in true-talent winning percentage, or 9.4 wins over a full season, reproduces the board's current ratio between the two legs. Readers can decide whether that figure is plausible.
How liquid is the Brewers leg?
Per-market figures from the gamma API on 20 September 2026 show about $107,287 of resting liquidity and $1,561,743 of cumulative volume on the Milwaukee leg, with a 0.6-point bid-ask spread at 14.7 by 15.3. That is deep enough for retail size and thin relative to the $40.8m the whole event has turned over, most of which sits in legs that have already resolved.
What happens to the market if a team is eliminated?
The published rules resolve a club's leg to No as soon as it becomes arithmetically impossible for that club to win the World Series. Twelve legs have already closed this way. A leg printing 100.0% would mean the market has resolved; none has, and none will until the final out on or before 31 October 2026.
Why does the board sum to more than 100%?
Boards with many legs usually trade at a small positive sum, because each leg carries its own spread and nobody is forced to arbitrage all eighteen at once. Here they sum to 103.8%. Comparing model output to raw mid-prices therefore overstates every apparent underpricing slightly, which is why the table above shows the normalised figures alongside.
When does the postseason bracket become final?
The regular season ends on 27 September 2026 and the postseason begins on 28 September, per MLB's own season calendar. Seeding, byes and home advantage are fixed at that point, and roughly half the variance in these prices disappears with them.
This article is analysis, not investment or betting advice. Prediction market contracts can expire worthless and your capital is at risk. Probabilities quoted here are estimates produced by a simulation with stated assumptions, not forecasts of what will happen. Links to Polymarket are affiliate links from which The Traders Spread may earn a commission at no cost to you.