

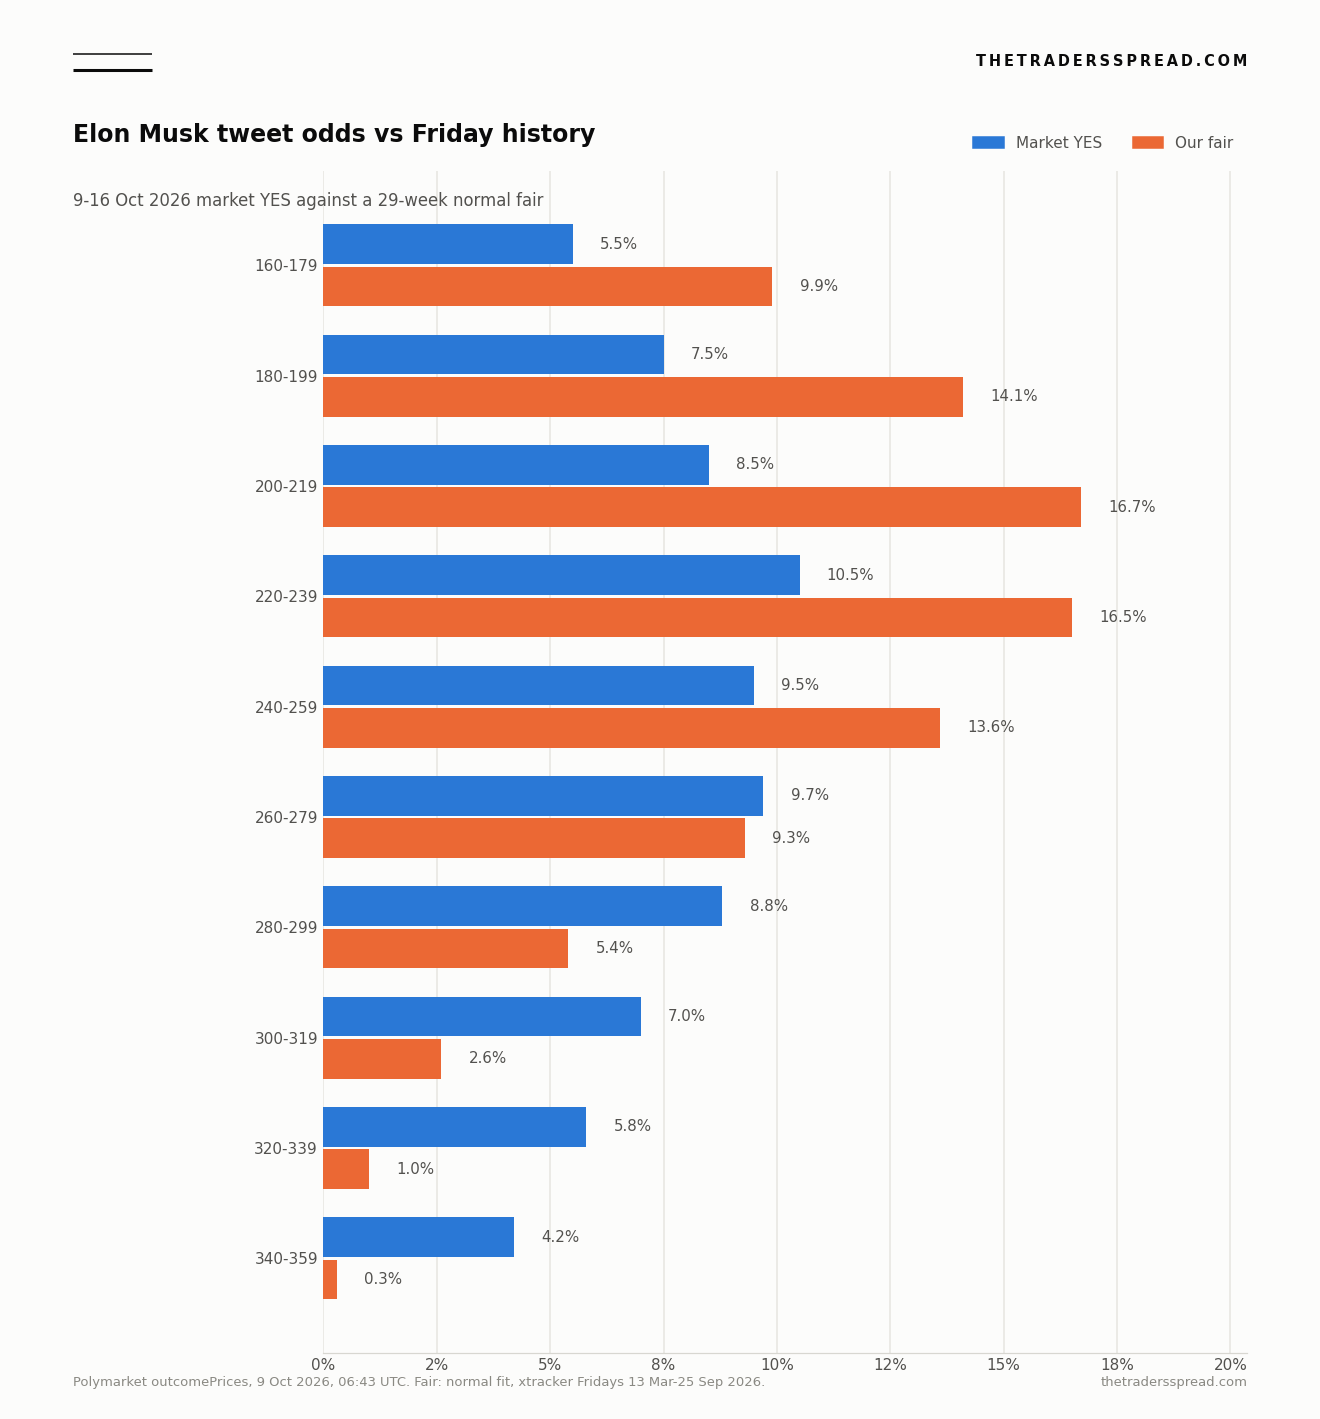
Elon Musk tweets October odds and the live count cannot both sit comfortably. Polymarket prices 220-239 posts at 10.5% for 9-16 October 2026, the richest YES on the ladder, while 260-279 sits at 9.65%. Forty posts higher, and the price barely moves. That is not a peak. The Friday window that ends at noon in New York today already shows 323 posts on the tracker this contract uses to resolve, and the sister book for 2-9 October prices 320-339 at 65.6%. A crowd that has just watched this week leave the 220s is still paying almost the same for 220-239 and for 260-279 on a week that opens only at that noon bell. The YES prices on the new ladder sum to 95.7%, a smear rather than a distribution with a mode.
From noon Eastern on Friday 2 October through Tuesday, the tracker logged 117 posts, about 26 a day. Wednesday added 80. Thursday added 126. The hour beginning 06:00 UTC on Friday 9 October still showed a cumulative 323, and that hour was empty. Two days did the lifting. Across 29 completed Friday-noon windows from 13 March through 25 September 2026 the mean was 218.2 and the median was 204. Only two weeks reached 300. The forward ladder still puts 30.4 percentage points of YES price on 300 and above. Rules and live prices are on the Polymarket page for Elon Musk posts from 9 to 16 October. Links to Polymarket are affiliate links, from which The Traders Spread may earn a commission at no cost to you.
Key facts at the 06:43 UTC pull
- Richest YES on the 9-16 October ladder: 10.5% for 220-239 posts, against 9.65% for 260-279 and 9.5% for 240-259. Source: Polymarket outcome prices, 9 October 2026, 06:43 UTC.
- Event volume $375,692, prior-24-hour volume $143,767, displayed liquidity $311,525, open interest $78,686. Source: Polymarket gamma API, updated 06:37 UTC on 9 October 2026.
- YES prices across all 26 rungs sum to 95.7%, not 100%. Source: Polymarket outcome prices, 9 October 2026, 06:43 UTC.
- 29 completed Friday windows, 13 March to 25 September 2026: mean 218.2, median 204, sample standard deviation 46.6, range 146 to 339. Two weeks finished at 300 or above. Source: xtracker.polymarket.com post counter, retrieved 9 October 2026.
- Week of 2-9 October, open until 16:00 UTC: 323 posts, with Wednesday 7 October at 80 and Thursday 8 October at 126 in Eastern time. Source: xtracker hourly series through the hour starting 06:00 UTC, 9 October 2026.
- Sister contract for 2-9 October: 320-339 at 65.6% (bid 65.5 cents, ask 65.6), on $5,710,238 of volume. Source: Polymarket, updated 06:39 UTC on 9 October 2026.
- Our fair on 200-219 is 16.7%, against an 8.5% YES price and a 9 cent ask. Below fair is a comparison, not an instruction. Source: normal fit to the 29 Friday totals, this desk, 9 October 2026.
Why Elon Musk tweets October odds have no peak
A peaked book names a center and then charges less as you walk away from it. This one does not. From 200-219 through 280-299 the YES prices are 8.5%, 10.5%, 9.5%, 9.65% and 8.75%. The best price and the fifth-best are less than two points apart. Traders are not defending a mode. They are renting a wide band.
Under 140 the rungs are scraps. Above the band the decay is slow, which is the expensive part. 300-319 is still 7.0%. 320-339 is 5.75%. 340-359 is 4.15%. Everything from 360 up, including the open 500+ rung at 2.65%, adds to 13.5%. No Friday in the 29-week set finished at 360 or higher.
Liquidity is not the excuse. The event shows $311,525 of liquidity against $375,692 of volume, and $143,767 traded in the prior day. The 200-219 rung has about $7,225 of volume and $13,052 of liquidity, with an 8 cent bid and a 9 cent ask. That ask is what a taker would pay. It is 9%, not 16%.
| Bucket | Market YES | Bid / ask | Normal fair | Weeks of 29 |
|---|---|---|---|---|
| 160-179 | 5.5% | 5 / 6 cents | 9.9% | 3 |
| 180-199 | 7.5% | 7 / 8 cents | 14.1% | 9 |
| 200-219 | 8.5% | 8 / 9 cents | 16.7% | 4 |
| 220-239 | 10.5% | 10 / 11 cents | 16.5% | 3 |
| 240-259 | 9.5% | 9 / 10 cents | 13.6% | 3 |
| 260-279 | 9.65% | 9.6 / 9.7 cents | 9.3% | 3 |
| 280-299 | 8.75% | 8.7 / 8.8 cents | 5.4% | 1 |
| 300-319 | 7.0% | 6.8 / 7.2 cents | 2.6% | 1 |
| 320-339 | 5.75% | 5.5 / 6 cents | 1.0% | 1 |
| 340-359 | 4.15% | 3.9 / 4.4 cents | 0.3% | 0 |
Read the middle of the table before the tails. Nine of the 29 Fridays finished in 180-199. Four finished in 200-219. Three finished in 220-239. The price is lowest of those three on 180-199 and highest on 220-239. The crowd has shoved the mode one or two buckets to the right of the count.
A book with a real posted mode looks nothing like this. The US-Iran ceasefire contract we wrote up was priced at 71.5% through 31 October. One number, one contract. Here the center is a five-rung plateau.
Summing every YES price gives 95.7%, and the gap to 100% is easy to misuse. The rungs are separate markets. That is not an arbitrage on the screen. Renormalizing makes the right tail a bit fatter: 30.4 points on 300 and above become about 31.8% of the priced ladder. The 200-219 rung stays cheap either way. 8.5 divided by 95.7 is still about 8.9%.
Twenty-nine Fridays on the resolution tracker
The base rate is a list, not a mood. The resolution source is the post counter at xtracker.polymarket.com. Matching windows run Friday 12:00pm Eastern to the next Friday 12:00pm Eastern, 16:00 UTC at both ends on daylight time. Every completed window of that shape from 13 March 2026 through 25 September 2026 is in the fit. That is 29 weeks. The unfinished week of 2-9 October is not.
The 29 totals run from 146 to 339. The mean is 218.2 and the median is 204, so a few heavy weeks pull the average up. The sample standard deviation is 46.6 posts. Fair value on the chart is a normal curve with that mean and spread. For each bucket it is the chance a draw lands inside, counting the half-post at each edge so 219 stays in 200-219 and 220 does not.
Raw bins are lumpier than the curve, so they sit beside it. 180-199 holds 9 weeks, 31%, against a fair of 14.1% and a price of 7.5%. 200-219 holds 4 weeks, 13.8%, against a fair of 16.7% and a price of 8.5%. Both sit above that price. 260-279, with 3 weeks, is the liquid rung where a 9.3% fair and a 9.65% price already agree.
The right tail is the disagreement. The window opening 13 March 2026 finished at 339, and the one opening 10 April finished at 305. That is 2 of 29, or 6.9%. March is the only sample week in 320-339. The market still shows 5.75% there, plus 13.5 points from 360 up, where the sample is empty. The low is 146, in the window opening 8 May 2026. Dull weeks and spring spikes both stay in. Dropping either would cook the fair.
The last eight completed Fridays, opening 7 August through 25 September, finished at 185, 253, 190, 226, 176, 204, 200 and 222. Mean 207, highest 253, none above 260. Using only that strip would call 300-and-above nearly impossible. They stay inside the 29. They do not replace it.
| Window opens | Posts | Bucket |
|---|---|---|
| 10 July 2026 | 160 | 160-179 |
| 17 July 2026 | 207 | 200-219 |
| 24 July 2026 | 270 | 260-279 |
| 31 July 2026 | 187 | 180-199 |
| 7 August 2026 | 185 | 180-199 |
| 14 August 2026 | 253 | 240-259 |
| 21 August 2026 | 190 | 180-199 |
| 28 August 2026 | 226 | 220-239 |
| 4 September 2026 | 176 | 160-179 |
| 11 September 2026 | 204 | 200-219 |
| 18 September 2026 | 200 | 200-219 |
| 25 September 2026 | 222 | 220-239 |
The counter is the one the market pays. The window opening 25 September finished at 222 on the tracker, and the Polymarket event for that week resolved on 220-239. Total and bucket match. This is not a third-party scrape hoping the definition lines up.
A low price on some other book is a different object. The 2026 leg on Putin leaving office was priced at 3.15% in our 7 October note. One unlikely question, one number. It is not evidence that every Polymarket ladder is a smear.
Two days moved the week this book is staring at
The 2-9 October window uses the same Friday clock and is the awkward fact. At 06:43 UTC the tracker had 323, with nine hours and 17 minutes left before the 16:00 UTC close. It is not in the sample, because it is not finished. It is also visible to everyone pricing the week that starts when this one ends.
By Eastern day, Friday 2 October from noon was 18, Saturday 27, Sunday 36, Monday 15 and Tuesday 21. That is 117 posts in 108 hours, 26.0 a day. Wednesday was 80 and Thursday was 126. Friday 9 October, through the hour starting 06:00 UTC, was zero. From 323 the count needs 17 further posts to touch 340, which is why a quiet overnight can leave 320-339 in front.
Continued at 26 a day, seven days would have landed near 182, inside 180-199. A straight line through Thursday's 126 invents a fantasy week. A straight line through the 29-week mean ignores 206 posts in 48 hours. Heavy days cluster. In this sample they still have not put 30% of weeks above 300.
The sister book has already priced the expiring window. On the 2-9 October event, updated 06:39 UTC, 320-339 was 65.6%, bid 65.5 cents and ask 65.6. The 340-359 YES was 27.9%, and 360-379 was 4.25%. Volume there was $5,710,238, against $375,692 on the forward week. Discovery has been happening on the contract about to die. The new one starts at zero, which is why its ladder can sit there without a peak.
He has described bursts after the fact. Elon Musk wrote on X, as Bloomberg reported via Silicon Valley on 11 June 2025, "I regret some of my posts about President @realDonaldTrump last week. They went too far." He told The Economist "I got carried away, frankly," about politics, which Richard Luscombe reported for The Guardian on 23 July 2026. Neither line is a posting quota. Both record output that ran ahead of the plan, which is why a 126-post Thursday is not yet a new daily rate.
If this week closes at 323 it will sit behind only the March print of 339, and ahead of April's 305. One week at the second-highest finish does not move a mean from 218 to 320. Two or three more would. That test is below. It is not a reason to throw out the list.
What counts, and the hour the new window opens
The forward total starts at zero. The tracker showed 0 for 9-16 October at 06:43 UTC because the window was shut. It opens at 12:00pm Eastern on 9 October 2026 and closes at 12:00pm Eastern on 16 October. Thursday's 126 posts do not carry over. They are a pace clue, not chips already on the table.
The event text names the unit. Main-feed posts, quote posts and reposts from @elonmusk count. Ordinary replies do not, though a main-feed reply can count if the tracker catches it. Deleted posts count if they stay visible for about five minutes. Community reposts the tracker misses do not count. The primary figure is the xtracker post counter, with X as a backup only if that counter fails the rules. September's resolution matched the tracker. That is the check we have.
A follower total or a newspaper line about "tweets per day" is the wrong input. Replies are mostly outside the count. The clock starts at noon, not midnight. Our Eastern daily split is a reading aid. Settlement will be one noon-to-noon total.
We are ignoring the tracker's pace field. The 6-13 October window showed a pace near 511 from a total of 219, using a coarse day count. The October month window showed a pace above 1,300 from 384 posts since 1 October. The 2-9 October feed called the window complete while also showing a day left, nine hours before 16:00 UTC. Totals match the market. That pace arithmetic does not.
RelatedSpain's Next PM Odds: Feijóo Leads the Book at 79.5¢
One price is allowed to be lonely. We read the US-invade-Iran book at 15.5% in an 8 October note. A reader can accept or reject that single figure. This ladder offers a band of rungs between 5% and 11% and calls the band a view.
The fair-value call
Our fair on 200-219 is 16.7%. The YES price is 8.5%, the bid is 8 cents and the ask is 9 cents, so the gap survives the price a taker would actually pay. Four of 29 Fridays landed in the bucket, 13.8%, which agrees on the direction if not on the second decimal. We mark the rung below fair. That compares a price with a count. It is not a suggestion to take a side, on the 200-219 contract or on any other rung.
The base case for the total is a finish between 180 and 239. That band holds 16 of the 29 weeks. The curve puts 14.1% in 180-199, 16.7% in 200-219 and 16.5% in 220-239. The mispricing inside that band is the slope: the market has 180-199 at 7.5% and 220-239 at 10.5%, the reverse of the week-count. A finish near the median of 204 would leave 200-219 too cheap, and 260-279, at 9.65% against a 9.3% fair, merely ordinary.
The high-count case is a week that stays hot after noon today. Buckets at 280 and above carry 39.2 points of YES price and only 3 of 29 weeks. Days near Thursday's 126 would make 200-219 the rich side. Days near 60 would push a seven-day total toward 420, which the sample has never seen. The low-count case is under 180, 4 of 29 weeks, including 146 in May. The 323 on the board does not transfer. The new counter starts at zero.
What would change the view is a second hot week, not a second hot day. Thursday at 126 still sits beside sample weeks of 305 and 339. If 9-16 October finishes above 300 and the next Friday does too, the mean of 218.2 is stale and the 16.7% fair should be cut. A tracker failure would change it faster, because the fair is only as good as the counter. Until then: no peak, a center around 200-219, and a right tail the 29 weeks do not pay for.
Questions that decide the reading
When does the 9-16 October count start and end?
It starts at 12:00pm Eastern on 9 October 2026 and ends at 12:00pm Eastern on 16 October, 16:00 UTC at both ends during daylight time. At the 06:43 UTC pull the tracker still showed zero, because the window was shut. Thursday's posts stay with the previous contract. The forward total does not inherit them.
Which posts actually count?
Main-feed posts, quote posts and reposts from @elonmusk count. Ordinary replies do not, though a main-feed reply can count if the tracker records it. A deleted post counts if it stayed up long enough to be captured, about five minutes in the event rules. Community reposts the tracker misses do not count. The resolving figure is the xtracker post counter, with X as a backup only if that counter fails.
Why is 10.5% described as no peak?
Because the neighbors do not step down. 240-259 is 9.5% and 260-279 is 9.65%, so a 40-post gap costs less than a point. 200-219 is 8.5% and 280-299 is 8.75%. Five rungs sit inside a band of about two points. A peak is a rung clearly richer than the ones beside it. This ladder's richest rung wins by a small margin, on prices that sum to 95.7%.
Where does the 16.7% fair on 200-219 come from?
From a normal curve on 29 completed Friday-noon totals, opening 13 March through 25 September 2026. The mean is 218.2 and the sample standard deviation is 46.6. The fair is the chance of landing inside 200-219. The raw count is 4 of 29 weeks, 13.8%. Both sit above the 8.5% price and the 9 cent ask. The open week at 323 is excluded because it has not finished.
Does 65.6% on 320-339 apply to next week?
No. That price is on the 2-9 October contract, which already has 323 posts and closes at noon Eastern today. It is a market dealing with a total it can see, plus whatever arrives in the remaining morning. The 9-16 contract starts over. The 323 is only a pace clue. Copying 65.6% onto a rung of the new week would treat a nearly finished count as a forecast.
Is the below-fair mark an instruction?
It is not. Below fair means the 8.5% price, and even the 9 cent ask, sits under the 16.7% assigned to 200-219 from the counted Fridays. The rung can still lose. A hot Friday afternoon would make that fair too high, and every other rung can expire at zero. The mark compares a price with a base rate. Capital is at risk, and nothing here is a recommendation.
This is analysis, not a recommendation. The 9-16 October contracts can expire at zero on every rung but one, and a single afternoon can move the count by more than a bucket. Prices, totals and bids were pulled at 06:43 UTC on 9 October 2026 and will have moved since. Capital is at risk.