

The Los Angeles Rams are the second-most expensive team on Polymarket's $57.07m Super Bowl LXI board this morning, trading at 11.5 cents, and they are only the third-most likely team to win their own division on the Polymarket market that prices exactly that question. Both numbers were read from the same API at 06:53Z on 19 September 2026. The 2027 champion board puts the Rams behind only the Buffalo Bills. The NFC West board puts them behind the San Francisco 49ers and the Seattle Seahawks, who sit level at 34.5 cents while the Rams sit at 31.5. One of those two prices is wrong, and the gap between them is the largest internal contradiction anywhere on a 32-leg board that has turned over $4.87m in the last seven days alone.
The useful way to measure it is a conversion rate: divide a team's de-vigged Super Bowl probability by its de-vigged division probability. That ratio tells you what fraction of a team's divisional equity the market expects to survive all the way through January. Across the sixteen NFC teams the average is 12.18%. Seattle converts at 18.49%, San Francisco at 18.34%, Buffalo at 17.17%, Baltimore at 14.83%, Kansas City at 13.06%. The Rams convert at 35.82%. No other team on the board is within twelve points of that, and the two teams who share their division, their schedule and their bracket sit at roughly half of it.
Key facts
- Polymarket's 2027 champion event carries $57,073,451 in lifetime volume and $7.84m of resting liquidity across 33 legs, 32 of them priced — Polymarket gamma-api, read 19 Sep 2026 06:53Z
- The 32 mid prices sum to 103.90%; the best offers sum to 106.90% and the best bids to 100.90% — gamma-api per-market
bestBid/bestAsk, 19 Sep 2026 - Rams: 11.5c on the champion board, 31.5c on the NFC West board, behind San Francisco and Seattle at 34.5c each — gamma-api, 19 Sep 2026
- The Rams leg has traded $176,024 in seven days; the entire NFC West division market has traded $29,455 since it opened on 3 March 2026 — gamma-api
volume1wkandvolumeNum, 19 Sep 2026 - Los Angeles lost Week 1 to San Francisco 27-7; the Rams are 0-1 with a net of -20, San Francisco and Seattle are both 1-0 — NFL official standings, nfl.com, 19 Sep 2026
- Seattle won Super Bowl LX 29-13 over New England on 8 February 2026 after a 14-3 regular season; the Rams finished 12-5 — nfl.com 2025 league standings
- Super Bowl LXI is scheduled for 14 February 2027 at SoFi Stadium, the Rams' home ground — NFL, via the Super Bowl LXI record
What the board is actually pricing
The event resolves to whichever team wins the 2027 NFL league championship. Any team that becomes mathematically eliminated resolves to No immediately rather than at the end, which matters for anyone holding a longshot through January. If the game is cancelled or pushed past 31 March 2027, a 33rd leg called "Other" resolves Yes; that leg is currently inactive and carries no price. The rules name nfl.com as the primary resolution source, with a consensus of credible reporting as backup. You can read the full 2027 champion market and its rules before anything else. Links to Polymarket are affiliate links, from which The Traders Spread may earn a commission at no cost to you.
The board is a negative-risk market, which is what makes the arithmetic clean. Because exactly one leg can resolve Yes, the 32 prices are a probability distribution and their sum is a direct measurement of the house edge. This morning they sum to 103.90%, so the overround is 3.90 points spread across 32 legs, or about 0.12 points a leg. That is tight for a futures board of this length. Our Nobel Peace Prize board left 40.5% of its probability mass unallocated; this one leaves almost none.
The bid and ask sums are more interesting than the mid sum. Lifting every offer on the board costs 106.90 cents to guarantee a dollar back, which is the true round-trip tax. Hitting every bid raises 100.90 cents against a dollar of liability, and since the inactive "Other" leg means a cancelled season pays the seller everything, that 0.90 of a point is the shape of a crowded book rather than an error. It tells you the market makers are comfortable on both sides at these prices, which in turn tells you the Rams number is not a stale quote sitting unloved in a corner.
Two boards, same four teams
Polymarket runs a separate market on each of the eight divisions. The NFC West champion market is thin by the standards of the main board, but it answers a narrower and more immediate question: which of these four teams finishes on top in January. Its four legs sum to 101.95%, so it is de-vigged much the same way.
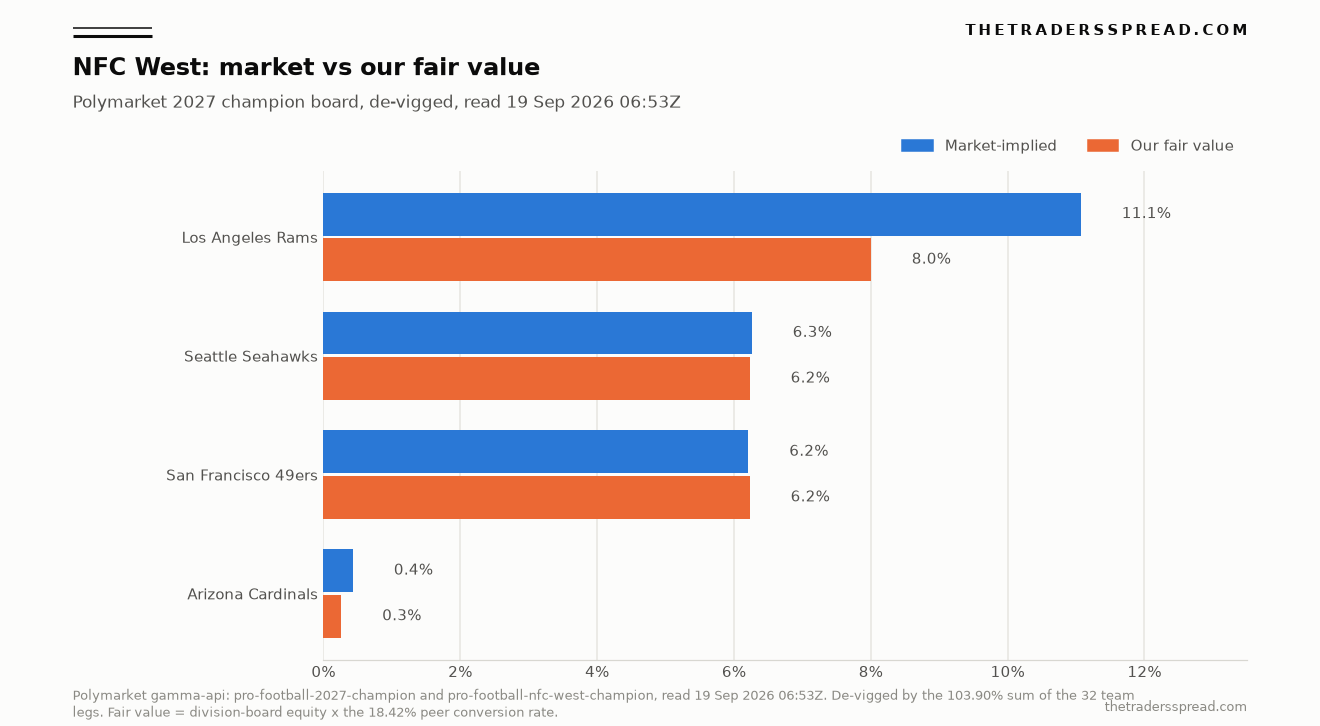
| Team | Champion board | De-vigged | NFC West board | De-vigged | Conversion |
|---|---|---|---|---|---|
| Los Angeles Rams | 11.50c | 11.07% | 31.50c | 30.90% | 35.82% |
| Seattle Seahawks | 6.50c | 6.26% | 34.50c | 33.84% | 18.49% |
| San Francisco 49ers | 6.45c | 6.21% | 34.50c | 33.84% | 18.34% |
| Arizona Cardinals | 0.45c | 0.43% | 1.45c | 1.42% | 30.45% |
| NFC average | — | 48.70% total | — | 400% total | 12.18% |
Read the last column again. Seattle and San Francisco are priced as though a third of their claim on the division survives to February. The Rams are priced as though more than a third of a smaller claim survives, which is a statement that Los Angeles is both less likely to win the division and considerably more likely to win everything. That combination is not impossible. A team can have a lower floor and a higher ceiling than its neighbours. But the three teams share six head-to-head games, a common set of rotating opponents, the same three wild-card slots and the same seven-team bracket, which strips out most of the usual reasons two conversion rates diverge.
The Cardinals sit at 30.45% on the same measure, and that one is noise. At a 0.1-cent tick size, a leg priced at 0.45 cents cannot express anything finer than a rounding error, so the ratio is arithmetic rather than opinion. The Rams leg is quoted 12.0 bid at 13.0 offered with $252,679 of resting size behind it. That is a real price.
The repricing that has already happened
The CLOB price history explains part of the gap and refuses to explain the rest. The Rams opened this board at 7.5 cents on 10 February 2026, climbed through free agency and the draft to a peak of 18.5 cents on 24 June, and were still at 17.5 cents in the first week of September. Then Week 1 happened.
On the daily series, the Rams leg went 16.5 on 11 September, 14.5 on 12 September, 12.5 on 13 September and has held 11.5 since 14 September. Over the same four days San Francisco went from 3.5 cents to 6.5. The division board moved harder and faster: the Rams NFC West leg was 53.0 cents on 11 September and 37.5 the next day, settling at 31.5, while San Francisco went 20.5 to 34.5 and Seattle climbed to 34.5 as well.
So both boards did reprice. The champion board took the Rams down 30% from 16.5 to 11.5; the division board took them down 41% from 53.0 to 31.5. That looks like a lag story, and it is tempting to write it as one. The price history says otherwise. On 11 September, before a single snap, the Rams were 16.5 on the champion board and 53.0 on the division board, a conversion rate of 31.1%, while San Francisco was 3.5 and 20.5, a conversion of 17.1%. The ratio was already nearly double then. The defeat widened a gap that was structural to begin with.
That is the part worth sitting with. If the anomaly had appeared on 12 September, it would be a slow-moving book catching up to a result, and it would close by itself. It did not appear on 12 September. It has been there since the division market opened in March.
The case for the price
There is a real one, and it needs stating properly before any conclusion is drawn.
Super Bowl LXI will be played on 14 February 2027 at SoFi Stadium in Inglewood. That is the Rams' own building. Two teams in NFL history have played a Super Bowl in their home stadium, Tampa Bay in Super Bowl LV and the Rams themselves in Super Bowl LVI, and both won. A home Super Bowl is a genuine, quantifiable reason for one team's conditional win probability to exceed 50% where every other team's sits at it. On a typical NFL home-field edge of a point and a half to two and a half, that conditional moves from roughly 50% to roughly 56%, an uplift of about 12% on the final leg of the path.
The second argument is scoring. Last season the Rams put up 518 points, more than Seattle's 483 and well clear of San Francisco's 437, while conceding 346 for a net of +172 against Seattle's +191 and San Francisco's +66. A team with that offensive distribution has a fatter right tail than its record implies, and fat right tails are exactly what a single-elimination tournament rewards. Call that another 12%.
The third argument is capital. The Rams' champion leg has traded $176,024 in the last week and $1,136,536 since February. The entire NFC West market, all four legs, has traded $29,455 in six and a half months. The champion board's weekly flow through one leg is six times the division board's lifetime turnover. When a $57m book and a $29k book disagree, the prior belongs with the $57m book, and anyone reasoning from the thin one is reasoning from a handful of tickets.
Stack those honestly. Take the peer conversion rate of 18.42%, the average of Seattle's and San Francisco's, and apply it to the Rams' 30.90% division equity: 5.69%. Add the home Super Bowl uplift: 6.37%. Add the scoring-ceiling uplift: 7.14%. Then weight upward once more for the fact that the deeper of the two books is the one saying the higher number. That lands at 8.0%.
What the division board can see that the champion board cannot
A division market is forced to price relative strength. It cannot express "all three of these teams are excellent" without taking probability from somewhere, because its four legs must sum to one. That constraint is usually treated as a weakness. Here it is the point. The NFC West board is the only instrument on Polymarket that makes San Francisco, Seattle and Los Angeles compete for the same fixed pool of probability, and when it does, the Rams come third.
The champion board faces no such discipline. Its 32 legs also sum to one, but the Rams' competitors for that probability are the Bengals and the Jaguars and the Giants, not the two teams who will decide in six meetings whether Los Angeles plays in January at all. A price can drift high on a 32-leg board for months simply because nobody is being paid to notice that three of its legs are structurally in each other's way. The NFC West is already 23.97% of the entire board and 49.2% of all NFC equity, and only one of those four teams can enter the bracket as a division winner.
The same shape turned up in our F1 drivers' title work, where the headline board and the constructor-level arithmetic implied different things about the same season, and in our TIME Person of the Year board, where the thin leg was the informative one rather than the deep one. Depth gets you a tight spread. It does not get you a second opinion.
The call
Our fair value on the Los Angeles Rams winning Super Bowl LXI is 8.0%. The market trades at 11.5 cents, 11.07% after de-vigging, so the leg sits about 3.1 points above fair on a de-vigged basis and 3.5 points above on the screen price. The quoted spread is 12.0 by 13.0, one full point wide, which consumes roughly a third of the gap on a round trip and leaves the rest.
RelatedPutin Out by New Year: The 2026 Leg Trades at 3.15%
The arithmetic is reproducible in five lines. De-vig the champion board by its 103.90% sum. De-vig the NFC West board by its 101.95% sum. Take the conversion rate of the Rams' two divisional peers, 18.42%. Apply it to the Rams' 30.90% division equity for 5.69%. Then add the two defensible premiums, a home Super Bowl and a league-leading scoring profile, and round upward for the fact that the deeper book disagrees with you. Every input is in the public market data and none of it requires a view on football.
What would change our mind, and quickly. All three NFC West contenders play inside the next sixty hours: Seattle at Arizona and Miami at San Francisco on Sunday 20 September, then New York Giants at the Rams on Monday night, 21 September, per the official Week 2 schedule. A Rams win paired with a San Francisco or Seattle loss collapses most of the division gap in one weekend and our fair value rises with it. A second Rams defeat while the other two hold would push the division board below 25% and take fair value under 6%. Longer term, the single fact that would retire this analysis is the NFC West board thickening: if its lifetime volume passes $250,000 and the Rams still sit third, the disagreement stops being a liquidity artefact and becomes two well-capitalised opinions, at which point the champion board has to move. Watch also for the Rams clinching a top-two seed, because a first-round bye changes the number of games between them and Inglewood from four to three, and our conversion-rate method has no way to see that coming.
We have covered boards where the thin market was simply wrong, including the Ballon d'Or board. This is not that. Here the thin market is the only one being asked the right question.
Frequently asked questions
What does de-vigging a Polymarket board actually do?
On a negative-risk event only one leg can resolve Yes, so the prices should sum to 100%. They sum to 103.90% here, and that 3.90-point excess is the market's built-in margin. Dividing every leg by 1.0390 strips it out and returns a probability distribution that adds to one. It is the only way to compare legs across two separate boards with different overrounds, which is exactly what this piece does.
Why compare the champion board to the division board at all?
Because they price overlapping claims on the same four teams and must be mutually consistent. A team's Super Bowl probability cannot be independent of its probability of finishing top of its own division, since the division result largely determines the seed, the bye and the route through January. The conversion rate between the two is the cleanest available consistency test, and it needs no model of football.
How reliable is a market that has only traded $29,455?
Not very, on its own. That is why our fair value of 8.0% sits well above the 5.69% the division board implies rather than at it. The division board is treated as evidence, weighted against a champion board carrying nearly two thousand times its volume. If the two ever traded at comparable size and still disagreed, the conclusion would be far stronger.
Does the Super Bowl being at SoFi Stadium really matter?
It is worth something and not nothing. Only two teams have played a Super Bowl at home, Tampa Bay in Super Bowl LV and the Rams in Super Bowl LVI, and both won, but two data points cannot carry much weight. Pricing it as a normal NFL home-field edge lifts the Rams' conditional win probability from about 50% to about 56%, which we have included in the 8.0%.
When does this market resolve?
Super Bowl LXI is scheduled for 14 February 2027 at SoFi Stadium in Inglewood, California. Eliminated teams resolve to No as soon as elimination is mathematically certain, so a longshot leg can settle months before the game. If the championship game is cancelled or postponed beyond 31 March 2027, the inactive "Other" leg resolves Yes and all 32 team legs resolve No.
Where do the numbers in this article come from?
All prices, volumes and liquidity figures come from the Polymarket gamma-api endpoint and the CLOB price-history endpoint, read at 06:53Z on 19 September 2026 and quoted per market rather than per event. Records, points for, points against and the Week 2 schedule come from the official NFL standings and schedule pages at nfl.com, which the market's own rules name as the primary resolution source.
Disclaimer
This article is analysis and information, not investment or betting advice, and no part of it recommends any position or side. Prediction market contracts can resolve to zero and you can lose the entire amount committed. Prices quoted were accurate at the timestamps given and move continuously. Do your own research and treat all capital as at risk.