

Is a weekly initial jobless claims contract pricing the seasonally adjusted count of new filings, or has the book quietly lined up with the monthly unemployment rate that arrives from a different agency?
The weekly contract names one Labor Department figure: seasonally adjusted initial claims for a Saturday-ending week. The monthly contract names the U-3 rate in the Bureau of Labor Statistics Employment Situation. The 29 October 2026 claims release, embargoed until 8:30 a.m. Eastern and numbered USDL 26-1624-NAT, put seasonally adjusted initial claims for the week ending 24 October at 194,000, down 1,000, after a prior-week revision up by 1,000 from 194,000 to 195,000, with a four-week average of 196,750. The September Employment Situation, embargoed until 8:30 a.m. Eastern on Friday 2 October and numbered USDL-26-1549, put the unemployment rate at 4.2 percent and unemployed people at 7.1 million, with payrolls up 29,000.
Updated 3 November 2026.
Weekly filings, the monthly survey rate, and the benefit-roll rate are three different objects. The steps below follow the weekly contract as written, then set it beside the monthly rate. The worked example is a settled February bracket: a gamma query for series_slug weekly-jobless-claims on 3 November 2026 returned four events, and every one was closed.
Read the question before the price
The example is "How many jobless claims during the week ending Feb 14?", slug how-many-jobless-claims-during-the-week-ending-feb-14-659. Gamma listed it closed, with an end date of 19 February 2026 and an event volume of 16,735.15. It resolves on seasonally adjusted initial unemployment insurance claims for the week ending 14 February 2026, from the Department of Labor's Unemployment Insurance Weekly Claims Report for that week. The report is typically released on Thursday at 8:30 Eastern, for the week ending the previous Saturday, and the market may resolve as soon as the report is out. The February 14 claims event is the template below. Links to Polymarket are affiliate links, from which The Traders Spread may earn a commission at no cost to you.
If that report is still unpublished 14 calendar days after the reference week ends, the market resolves to the lowest bracket. A week ending Saturday 14 February makes that window run out on Saturday 28 February, so a late release settles in the bottom bucket on the text as written. The source named in the rules is dol.gov/ui/data.pdf. The dated newsroom releases opened for the figures here are the same series, each with its own release number. Gamma dates the event's creation to 12 February 2026, when the prior week's report was already public and the Saturday in the title still lay ahead.
Name the print the rules actually use
The 19 February release, USDL 26-269-NAT, covered the week in the question. Seasonally adjusted initial claims for the week ending 14 February were 206,000, down 23,000. The week ending 7 February was revised up by 2,000, from 227,000 to 229,000. The four-week average was 219,000, down 1,000. The unadjusted count was 207,694, down 42,509, or 17.0 percent, against a seasonal factor that had expected a decrease of 19,669, or 7.9 percent. The comparable unadjusted week in 2025 was 223,538.
The nearness of 206,000 and 207,694 is one week, and a poor thing to generalise. The 12 February release, embargoed until 8:30 a.m. Eastern on Thursday 12 February 2026, put the week ending 7 February at 227,000 adjusted and 248,397 unadjusted. Unadjusted claims fell 4,555, or 1.8 percent, while factors had expected an increase of 1,161, or 0.5 percent. On 29 October the gap runs the other way: 194,000 adjusted against an unadjusted 178,851, up 5,648 or 3.3 percent, where factors had expected a rise of 6,040 or 3.5 percent, and the comparable unadjusted week in 2025 was 203,012. Adjusted and raw brackets would have been different contracts in both weeks.
The same releases carry insured unemployment, which the weekly question leaves alone. On 19 February, seasonally adjusted insured unemployment for the week ending 7 February was 1,869,000, a 1.2 percent rate, up 17,000, with the prior week revised down by 10,000 from 1,862,000 to 1,852,000, on covered employment of 153,398,888. By 29 October the insured rate was 1.1 percent on 1,701,000 people for the week ending 17 October, and the denominator footnote read 153,911,765. Insured unemployment counts people already on the rolls. Initial claims count new filings, and that is the line the question names.
Separate the Saturday week from the Thursday release
The question's week ends on a Saturday, and the answer arrives on a Thursday. Three embargo lines are clean: 8:30 a.m. Eastern on Thursday 12 February 2026 for the week ending 7 February; Thursday 26 February 2026 for the week ending 21 February; and Thursday 29 October 2026 for the week ending 24 October. Each describes the Saturday five days earlier.
The 19 February PDF, the first printing of 206,000, fails that check. Its text extract garbles the embargo line, with a stray "Thursday, February 1" folded into the body, while the lead still names the week ending 14 February and the release number is still USDL 26-269-NAT. Gamma's end date is 19 February 2026, and the rules say the report is typically out Thursday at 8:30 Eastern. The garbled line stays as the file left it. Last CLOB trades on the seven brackets, for the window ending 13:30 UTC on 19 February 2026, carry timestamps from 13:20:19 to 13:20:24 UTC, which is 8:20 a.m. Eastern, ten minutes before the hour the rules call typical. The prices below are those pre-release trades, history from a closed market.
Walk the brackets, including the edge the rules leave open
Gamma returned seven questions in this order: less than 200,000; between 200,000 and 210,000; 210,000 and 220,000; 220,000 and 230,000; 230,000 and 240,000; 240,000 and 250,000; and at least 250,000. Settled yes prices were 0, 1, 0, 0, 0, 0 and 0. VolumeNum was 5,430.68, 9,588.83, 413.99, 443.84, 299.98, 349.97 and 207.87, summing to the event volume of 16,735.15. LiquidityNum on the closed legs came back empty. The winning question is between 200,000 and 210,000, and 206,000 sits in the interior of that band.
The rules name the report and leave the round ten-thousand boundary unstated. "Between 200k and 210k" and "between 210k and 220k" could both claim 210,000, or the first could stop short of it. The fair-value count below uses a stated convention: each between-band starts at its lower number and stops short of the next threshold, and "at least 250k" includes 250,000. Both 206,000 and the later 208,000 are interior either way. The ambiguity leaves the settled week unchanged and touches only one of the ten fair-value paths.
The 26 February release, embargoed until 8:30 a.m. Eastern that Thursday, revised the contract week up by 2,000, from 206,000 to 208,000, and both figures stay inside 200,000 to 210,000. The four-week average moved with it: the 19 February release had printed 219,000, and the 26 February release revised that average up by 500 to 219,500, while the new week's own average was 220,250. The weekly text is silent on whether a later revision is ignored. How a proposal and a dispute work is the separate question of who can challenge a resolution once it is proposed. The October unemployment contract says later revisions fall outside its resolution. The weekly text has nothing parallel.
The average and the weekly print were already in different bands on the first release. Under the convention above, 206,000 is a 200,000-to-210,000 print and the 219,000 average is a 210,000-to-220,000 print. After the revision, 208,000 and 219,500 are still in different bands. Pricing the smoother average prices a different question from the one the contract asks.
Set the weekly count beside the monthly rate
The monthly book open on this retrieval is october-unemployment-rate-2026. Gamma listed it open, ending 6 November 2026 at 13:30 UTC, with an event volume field of 36,275.34 and an event liquidity field of 26,821.79. It resolves on seasonally adjusted U-3 for October 2026, Table A-15, at the first release, to one decimal. The release is scheduled for 6 November 2026 at 8:30 a.m. Eastern, the same clock the September page gives. Later revisions fall outside that resolution. If October data remain unpublished when the next month is due, the market uses the last available month. The October unemployment-rate event is a different contract, and it is still a stack of brackets.
Yes prices, in gamma's order, were 0.0015, 0.0045, 0.073, 0.265, 0.425, 0.165, 0.0145, 0.0005 and 0.0015, for 3.8 percent or lower through 4.6 percent or higher. They sum to 0.9505, short of a full distribution. The modal leg is 4.2 percent at 0.425, bid 0.42 and ask 0.43, volumeNum 11,288.80, liquidityNum 2,568.22. The first leg, 3.8 percent or lower, was 0.0015 on volumeNum 757.70. The 4.0 percent leg was wide, bid 0.02 and ask 0.126, on volumeNum 1,666.16. The first row can look like a market on an extreme print. The volume sits in the middle of the stack.
The Employment Situation opened here is still September: 4.2 percent, a range of 4.1 to 4.3 percent that the BLS said had held since March, and 7.1 million people unemployed, with payrolls up 29,000. July was revised from a gain of 21,000 to a loss of 10,000, and August from a gain of 162,000 to a gain of 133,000, so July and August combined were 60,000 lower than previously reported. What moves the monthly unemployment-rate market covers that bucket, and what moves the nonfarm-payrolls buckets covers the other half of the same Friday release. September's 4.2 percent matches the modal October bracket and belongs to a prior month. The October report was still on the schedule.
The releases keep the objects apart. Initial claims of 194,000 are a flow of new filings for one week. The 4.2 percent rate is a household-survey stock for September. The 1.1 percent insured rate is continued claims over covered employment of 153,911,765. Averaging a filing count, a survey rate and a benefit-roll rate answers none of the three contracts.
Replay one settled week, tape first and release second
Blue bars on the chart are the last CLOB trade on each yes token at about 13:20 UTC on 19 February 2026. Orange bars are the ex-ante fair value below. The last trades were 0.024, 0.0345, 0.46, 0.395, 0.45, 0.295 and 0.23, summing to 1.8885, or 188.85 cents. Several prints held at once are left unscaled. The chart label rounds 0.0345 to 3.5 percent, and the prose keeps the CLOB print.
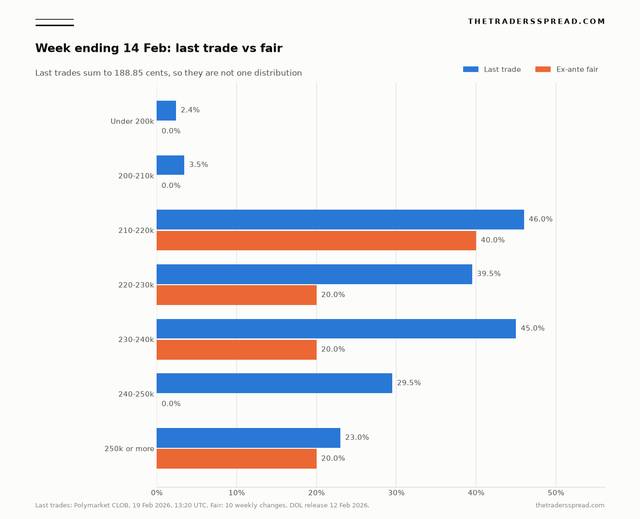
Volume and the last trade disagree. The 210,000-to-220,000 leg last traded at 0.46 on volumeNum of only 413.99. The leg that resolved yes last traded at 0.0345 on volumeNum of 9,588.83, the largest of the seven. The 230,000-to-240,000 leg last traded at 0.45 on volumeNum of 299.98. A high last trade on a thin leg is a weak stand-in for a probability when the seven prints fail to form one distribution.
Fair value is an equal-weight replay of ten changes already in print, with the weights left flat. The base is 227,000, the advance figure for the week ending 7 February in the 12 February release, the number a reader could have known before the next report. The revision of that week to 229,000 arrived in the same 19 February document as the 206,000 print, too late to serve as a base. The ten changes are the prior-week column for the weeks ending 6 December 2025 through 7 February 2026 in that 12 February historical table. Its last row is 227, a change of minus 5, and an average of 219.50, matching the lead of 227,000, down 5,000, average 219,500. Counting back from that matched row, the changes in thousands are +45, −13, −9, −15, +7, −8, +11, −1, +23 and −5.
Related6-point swing hits the Senate tossup slate on Polymarket
Added to 227,000, the paths land at 272,000, 214,000, 218,000, 212,000, 234,000, 219,000, 238,000, 226,000, 250,000 and 222,000. Four fall in 210,000 to 220,000, two in 220,000 to 230,000, two in 230,000 to 240,000, and two at 250,000 or above. The under-200,000 band, the 200,000-to-210,000 band and the 240,000-to-250,000 band each get zero paths, so the fair values are 0, 0, 0.40, 0.20, 0.20, 0 and 0.20. The 250,000 path is 227,000 plus 23,000, the only boundary case, and it sits in "at least 250k" only because of the convention above.
The figure that printed was 206,000, inside the band the sample had priced at zero. The window put zero weight on a drop of 21,000 from 227,000, and the week fell 23,000 from that unrevised base. The heaviest sample band, 210,000 to 220,000 at 0.40, last traded at 0.46. The winning band last traded at 0.0345 against a fair value of zero, so the pre-release tape sat above that fair, and the settled yes price is now 1. The theme panel stores a different row.
The week-ending-21-February claims event resolved to the 210,000-to-220,000 leg on a gamma volume of 2,091.82, with an end date of 26 February 2026. The 26 February release put that week at 212,000, up 4,000, interior to the winning leg. The prior event, the week ending 7 February, resolved to 220,000-to-230,000 on a gamma volume of 10,763.08, beside the 227,000 advance in the 12 February release. Two settled weeks line up with the two releases opened for them.
Check whether any week is actually open
The series query returned those three February weeks plus the week ending 28 February, end date 5 March 2026, volume 195.38, resolved to 210,000-to-220,000, and all four events were closed. The 28 February result stays a gamma resolution, because that week's Labor Department release stayed unopened and an official print is left unpaired. The latest official print opened here is still 194,000 for the week ending 24 October. The series list has that week nowhere, and it has nothing after February, so a live weekly book was absent from the retrieval. The October unemployment event is the live contract, and it answers a different question.
Where the stored comparison lands
The theme reads the first market in the event, which here is "less than 200k". Its settled yes price is 0. The ex-ante fair on that same leg is also 0. Equal prices are what the theme labels At fair, and the stored call that matches an equal reading is avoid. A settled zero is a closed print, and the 3 November retrieval showed every claims week in the series already shut.
Ten minutes before the typical release hour, that under-200,000 leg last traded at 0.024, above the sample fair of zero. The winning leg is a separate comparison: a pre-release trade of 3.45 cents against a sample fair of zero, then a settled yes price of 1, on an official print of 206,000 that a later revision took to 208,000 while staying inside the band. The theme follows the first market in the gamma list rather than the market with the volume, so the panel is the wrong row for anyone reading it as a summary of the leg that won.
FAQ
What does a weekly initial jobless claims contract settle on?
The worked example settles on the seasonally adjusted number of initial unemployment insurance claims for one Saturday-ending week, from the Department of Labor's Unemployment Insurance Weekly Claims Report. For the week ending 14 February 2026, the 19 February release put that advance figure at 206,000, beside an unadjusted count of 207,694. The monthly unemployment rate is a Bureau of Labor Statistics series from a different release on a different morning.
Can a later revision move the claims bracket?
The claims rules for the February week stay silent on later revisions. On 26 February the Department of Labor revised the 14 February week from 206,000 to 208,000, and both figures sit inside the 200,000 to 210,000 band that resolved yes. The October unemployment-rate contract says later revisions fall outside its resolution. A claims revision large enough to cross a ten-thousand boundary is a case the weekly rules leave open.
Why use a settled February contract for the comparison?
A gamma query for the series weekly-jobless-claims on 3 November 2026 returned four events, and each one was closed, covering the weeks ending 7, 14, 21 and 28 February. The latest official advance figure opened here is 194,000 for the week ending 24 October 2026, from the 29 October release. With only closed weeks on that series, the comparison uses the settled template.
This page is a reading of published contract rules and official releases. It is not a recommendation to buy or sell any contract.