

"MAS will therefore maintain the rate of appreciation of the policy band," the Monetary Authority of Singapore wrote on 14 October 2026, and that path is the Singapore dollar half of how GBP/SGD is priced. The other half is Bank Rate. On the Bank of England interest-rate page, last updated 12 October 2026, Bank Rate is shown at 3.75 percent, and the next decision is listed as 5 November 2026. The cross is what remains after each of those regimes has been turned into a dollar rate.
We read GBP/SGD as the product of GBP/USD and USD/SGD. On the ECB reference date 3 November 2026, retrieved through Frankfurter on 4 November 2026, one pound bought 1.3411 dollars and one dollar bought 1.2812 Singapore dollars. Multiply those prints and the product is 1.7182. The direct GBP/SGD reference for the same date is 1.7181, and the gap of one ten-thousandth is rounding on the two legs. The policy point sits next to the arithmetic. The MAS framework page says intervention is a sale or purchase of US dollars against the Singapore dollar, preferred because that is the most liquid Singapore dollar pair. A shift in the policy path lands in USD/SGD, and GBP/SGD inherits it. Bank Rate lands in GBP/USD, and the cross inherits that as well.
A reader who types gbp sgd into a search box is looking for a price that is assembled. One machine publishes a number, and the other publishes a path for a basket, and the dollar is the joint between them.
Updated 4 November 2026
How is GBP/SGD built from two dollar rates?
Frankfurter republishes the ECB euro foreign exchange reference rates, and the cross is computed from them. The pull on 4 November 2026, for 4 November 2025 through 4 November 2026, returned 255 dates ending on 3 November 2026. On the first date the sterling-dollar rate was 1.3065, the dollar-Singapore dollar rate was 1.3064, and GBP/SGD was 1.7069, against a product of the legs of 1.7068. On 29 January 2026, the high of the cross in this window, the legs were 1.3817 and 1.2640 and the cross was 1.7465, matching the product to the fourth decimal. On 2 October 2026, the low, the legs were 1.3201 and 1.2798 and the cross was 1.6895, again matching to the fourth decimal.
Across the window the cross rose from 1.7069 to 1.7181, a gain of 0.0112 Singapore dollars per pound, or 0.66 percent. Cable rose from 1.3065 to 1.3411, or 2.65 percent. The dollar-Singapore dollar rate fell from 1.3064 to 1.2812, or 1.93 percent, which is a stronger Singapore dollar against the dollar. Multiply the gross changes, 1.0265 by 0.9807, and the result is about 0.67 percent, against 0.66 percent on the cross, with the residual down to rounding. The small move in GBP/SGD is a large move in sterling, partly offset by a Singapore dollar that also strengthened against the dollar.
NOK/SEK is built the same way, from two dollar rates, and that cross can look quiet while each leg moves further, provided the legs lean opposite ways against the dollar.
On a dealing ticket the structure matches the reference identity. A ticket that delivers pounds against Singapore dollars is covered in sterling-dollar and in dollar-Singapore dollar, and the side of each cover depends on which way the ticket faces. The spread has to pay for both covers and for any gap in time between them. On the 3 November levels, one ten-thousandth on cable times the dollar-Singapore dollar rate of 1.2812 moves GBP/SGD by about 0.00013, and one ten-thousandth on that dollar rate times cable at 1.3411 moves it by about 0.00013 as well. The two legs have a similar grip, so a wider quote in either one arrives in the cross at roughly that multiple, with a delay between the covers adding a buffer.
What path does the Singapore dollar leg follow?
Monetary policy in Singapore is centred on the exchange rate. The MAS framework FAQ, last revised on 25 April 2024 and still the page we opened, says that unlike most central banks, which target interest rates, MAS uses the nominal exchange rate as the intermediate target. The reason given there is the shape of the economy: gross exports and imports of goods and services are more than 300 percent of GDP, and almost 40 cents of every dollar spent domestically is on imports, so the exchange rate has a much stronger influence on inflation than the interest rate.
The operating framework is the basket, the band and the crawl. The intermediate target is the Singapore dollar nominal effective exchange rate, a trade-weighted basket whose composition and weights, the FAQ says, are reviewed as Singapore's trade pattern changes. The three levers are the slope of the band, which is the rate of crawl, the width, and the level at which the band is centred. A numeric weight for sterling is absent from the page we opened, and so is a slope stated in percent per year. The October statement gives the direction of the slope in words.
The 14 October 2026 statement says MAS will maintain the rate of appreciation of the policy band. It records that the July 2026 review had increased that rate very slightly, with the width and the centre left as they stood, and the October decision kept the width and the centre where they were as well. Advance estimates from the Ministry of Energy, Trade and Industry, as the statement cites them, have Singapore GDP up 5.4 percent year on year in the third quarter of 2026 and up 1.1 percent quarter on quarter, seasonally adjusted. MAS core inflation, which excludes accommodation and private transport, rose to 2.1 percent year on year in July and August, from 1.5 percent in the second quarter. For 2026 the statement forecasts core inflation at 1.5 to 2.0 percent and CPI-all items around 2.0 percent, and for the following year it projects both at 1.5 to 2.5 percent.
Domestic interest rates sit downstream of that path. The same FAQ says that, with open capital markets, rates such as SORA generally track global rates, notably US dollar SOFR, and can sit at a discount when the Singapore dollar is expected to appreciate. Exchange-rate policy is described as Singapore's monetary policy, and daily money-market operations supply settlement balances apart from that setting. Funding on the Singapore dollar side of GBP/SGD clears once the basket path and the global dollar rate are known. Bank Rate, on the other side, is the setting itself.
Because the intervention pair is the US dollar against the Singapore dollar, the policy trade is the same market as the dollar-Singapore dollar leg. Sterling enters the basket only to the extent of a weight the FAQ leaves off the page we opened. A cable move can still change GBP/SGD one for one with the identity, while the basket, and any policy reaction to it, is read off the wider set of trading-partner currencies.
MAS posted the October decision from the account linked on mas.gov.sg, restating the path in one note on 14 October 2026.
MAS has released the October 2026 Monetary Policy Statement. MAS will keep the policy band on its prevailing appreciation path. There will be no change to the width of the band and the level at which it is centred.
— MAS (@MAS_sg) October 14, 2026
READ: https://t.co/4BfiLfiQwZ
Where does Bank Rate show up in the sterling leg?
At its meeting ending on 16 September 2026, the Monetary Policy Committee voted by a majority of 6-3 to maintain Bank Rate at 3.75 percent, and three members voted to increase Bank Rate by 0.25 percentage points, to 4 percent. The minutes, published on 17 September 2026, name the six who preferred to hold as Andrew Bailey, Sarah Breeden, Swati Dhingra, Clare Lombardelli, Dave Ramsden and Alan Taylor, and the three who preferred the increase as Megan Greene, Catherine L Mann and Huw Pill. The same meeting voted unanimously to reduce the stock of UK government bonds held for monetary policy purposes to zero, and the minutes describe Bank Rate as the active policy tool. For the sterling leg of GBP/SGD, the number that maps into cable is Bank Rate, with the balance-sheet plan running beside it.
The minutes state that UK CPI inflation increased to 3.1 percent in August. The Bank Rate page, last updated 12 October 2026, displays a current inflation rate of 3.5 percent against a 2 percent target, while the September key points on that page still say inflation has risen to 3.1 percent. On energy, the minutes record Brent at 106 dollars a barrel and UK wholesale gas at 207 pence a therm at the close on 14 September, and a staff projection, on those prices, of CPI inflation around 3.75 percent in the fourth quarter of 2026 and slightly above 4 percent in the first quarter of 2027. The split vote is a sterling-side input, and it reaches GBP/SGD after it has reached cable.
Andrew Bailey, Governor, says on the Bank Rate page: "Today, we've held Bank Rate at 3.75%." The Bank of England account posted the vote on 17 September 2026, the morning of the announcement.
The Monetary Policy Committee voted 6-3 to keep the interest rate at 3.75%.
— Bank of England (@bankofengland) September 17, 2026
Find out more:https://t.co/GHHt7QdrbF pic.twitter.com/9tlJ8aqmM9
The pages opened on 4 November 2026 still listed 5 November 2026 as the next decision date, so the reference set stops at the documents in hand that day. A later Bank Rate would show up first as a different sterling-dollar rate, and only then as a different GBP/SGD, through the same product used for 3 November.
Which session carries the dealing in this cross?
The BIS press release of 30 September 2025, on the April 2025 triennial survey, puts global FX turnover at 9.6 trillion dollars a day, with the dollar on one side of 89 percent of trades and sterling's share at 10.2 percent. Sales desks in the United Kingdom accounted for 38 percent of turnover, the same share as three years earlier, and the United Kingdom, the United States, Singapore and Hong Kong SAR together accounted for 75 percent.
The MAS release of 1 October 2025 puts Singapore's average daily FX volume at 1.485 trillion US dollars in April 2025, up 60 percent from April 2022, and its global share at 11.8 percent, up from 9.5 percent, which left Singapore the third-largest centre after the United Kingdom and the United States. Lim Cheng Khai, Executive Director of the MAS Financial Markets Development Department, said the volumes reflected "deeper liquidity in the Asian time-zone to support economic and hedging needs in the region." The annex lists sterling average daily volume in Singapore at 78,797 million US dollars and the Singapore dollar at 118,874 million, on a currency basis that the footnote says sums to twice the centre total, because each trade has two sides.
Sterling's largest pool, on those shares, is London, and the Singapore dollar's home pool is still a fraction of that, so GBP/SGD joins a London-centred currency to a Singapore-centred one. The survey is a centre total for April 2025, and an hour-by-hour print for this pair is absent from the release. The clock is a separate fact. Singapore stays at UTC+8 all year, and from 25 October 2026, the last Sunday of that month, London is on GMT and eight hours behind until late March. Taking a staffed day as 08:00 to 17:00 local time, a desk convention for when people are in the chair, the overlap is 08:00 to 09:00 in London, which is 16:00 to 17:00 in Singapore.
Before 08:00 in London the Singapore morning is underway and sterling is on the overnight book. After 17:00 in Singapore, London still has its afternoon, New York included, and the Singapore dollar leg is a price carried outside Singapore hours. We traced the same gap, a sterling cross whose spread changes when a local centre comes in, for the Johannesburg open in GBP/ZAR.
Why does the quoted spread change when the two centres are apart?
While both desks are staffed, a market maker can cover cable and cover the dollar-Singapore dollar leg while the ticket is still live. The cross spread then sits close to the two leg spreads, each scaled by the other rate, plus a small buffer for slippage. On the 3 November levels those scalings are almost equal, so whichever leg is quoted wider on the day contributes more of the cross spread.
RelatedWhy GBP/ZAR Spreads Change at the Johannesburg Open
Once Singapore has closed, the dollar-Singapore dollar quote is whatever book is still making it in London or New York, thinner than the Singapore afternoon. The cover can move before it is done, so the cross spread picks up the extra width of that leg and a buffer for the delay. The reference rate on the chart keeps printing through those hours because the ECB reference is a daily rate, while a dealing spread is a two-way price at a time of day, and the two answer different questions.
While London is closed and Singapore is open, the thin leg is cable, because sterling's deep pool on the BIS shares is in the United Kingdom. The cross is then a live Singapore dollar leg against a quieter sterling leg, the mirror of the London afternoon. A pip-by-hour spread from a primary venue is absent from the sources opened for this reading, and the width in pips belongs to whatever book publishes it, with a timestamp. The direction of the change is the stable part: tighter in the hour when both centres are staffed, and wider when one cover is done in a thinner book.
What does one year of reference prints show?
The chart is the ECB reference series for GBP/SGD, 255 dates from 4 November 2025 to 3 November 2026. The reference high is 1.7465 on 29 January 2026, when cable was 1.3817 and the dollar-Singapore dollar rate was 1.2640. The reference low is 1.6895 on 2 October 2026, with cable at 1.3201 and the dollar-Singapore dollar rate at 1.2798. From the high to the low the cross fell 0.0570 Singapore dollars per pound, or 3.26 percent, and the last print of 1.7181 sits 0.0112 above the first print of 1.7069.
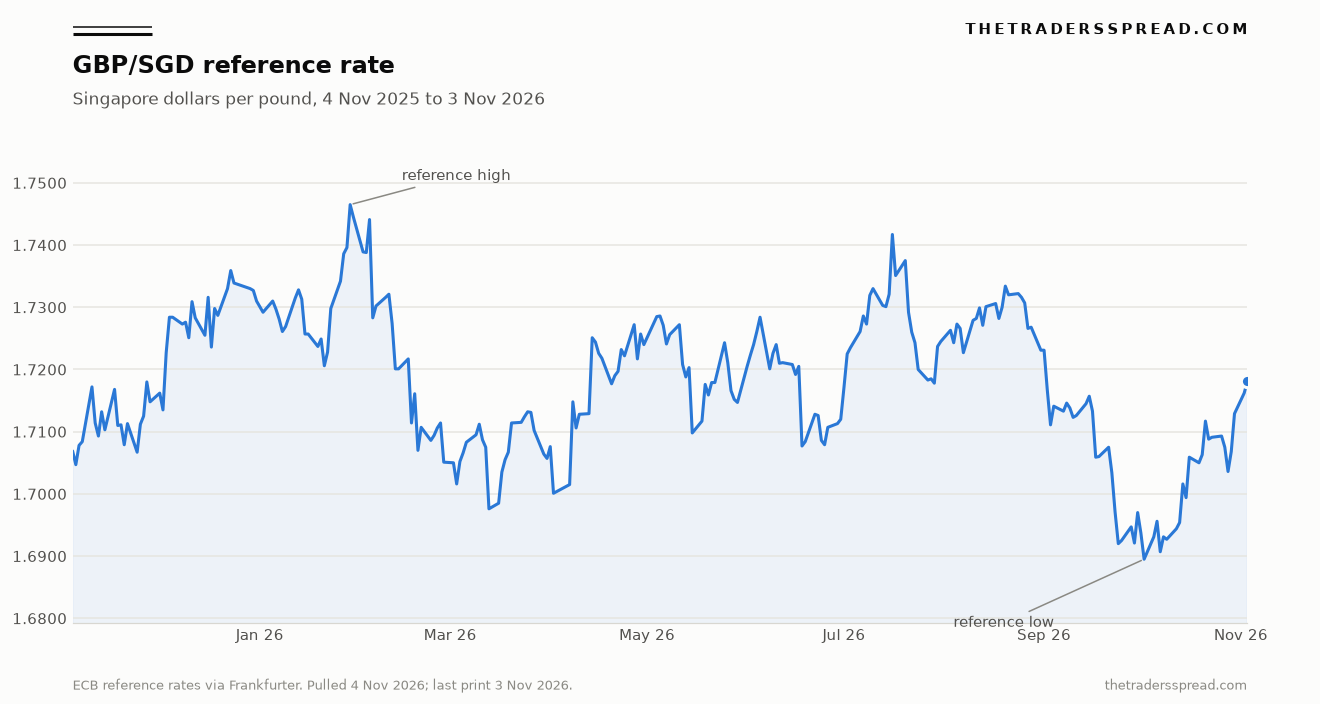
Prints on decision dates stay separate from the decisions. On 17 September 2026 the GBP/SGD reference was 1.7059, with cable at 1.3376 and the dollar-Singapore dollar rate at 1.2753. On 14 October 2026 the reference was 1.7016, with cable at 1.3267 and the dollar-Singapore dollar rate at 1.2826. A daily move around a decision mixes both legs with everything else in the dollar, so the setting and the product stay in different sentences.
The early-October low lines up with cable at 1.3201, the soft reading in this set, while the dollar-Singapore dollar rate was 1.2798. The January high lines up with cable at 1.3817 and a dollar-Singapore dollar rate of 1.2640, the low of these dates. Both extremes were cable moves with the Singapore dollar leg leaning the same way, which is why the 0.0570 range is wider than the net change from the first date to the last.
What data would change this mechanism?
Three joints hold the account together, and each one fails on a specific publication.
The first joint is the Singapore dollar leg as a basket path. The FAQ says the weights are reviewed as trade changes, and the October statement gives the slope as maintain, after recording a very slight increase in July. A published weight for sterling, and a slope stated in percent per year, would let the statement map onto GBP/SGD partly as an ingredient of the instrument. Until those numbers are on the page, the mapping runs through USD/SGD, the pair MAS says it uses for intervention, and through the identity.
The second joint is the asymmetry of the two regimes. Bank Rate is a number, 3.75 percent in September with the dissenters at 4 percent, and the Singapore dollar side is a path. The FAQ treats the exchange rate as the intermediate target and treats SORA as a rate that follows global funding and the expected currency path. If MAS made a policy interest rate the operating target, the way the Bank of England uses Bank Rate, the Singapore leg would be read off that rate. The product of the two dollar rates would remain the calculation, and the policy story would become two interest rates.
The third joint is the hour. The triennial gives the centre shares already cited, and it leaves the hour-of-day split for GBP/SGD unpublished. A table of this pair's turnover by hour, from the BIS survey or from the Singapore foreign-exchange volume survey, would replace the clock with a measured share. The clock moves with the seasons: on British Summer Time the gap to Singapore is seven hours and the overlap of two staffed days is two hours, and on GMT, as since 25 October, the overlap is the single hour above. A desk staffed through the other centre's afternoon would change the spread pattern even with that clock held fixed.
The mechanism stands while ECB reference dates still multiply out to GBP/SGD within a ten-thousandth, while Bank Rate remains the active sterling tool, and while MAS maintains the slope and intervenes in the US dollar pair. Fresh prints of that kind confirm the machine. They alter it when the slope, the sterling weight or the intervention pair changes in the text.
This page is a desk reading of how GBP/SGD is assembled from two dollar rates and from the hours the two centres are staffed. It is a record of sources opened on 4 November 2026. It is not a forecast, a price target, or a recommendation to transact.