

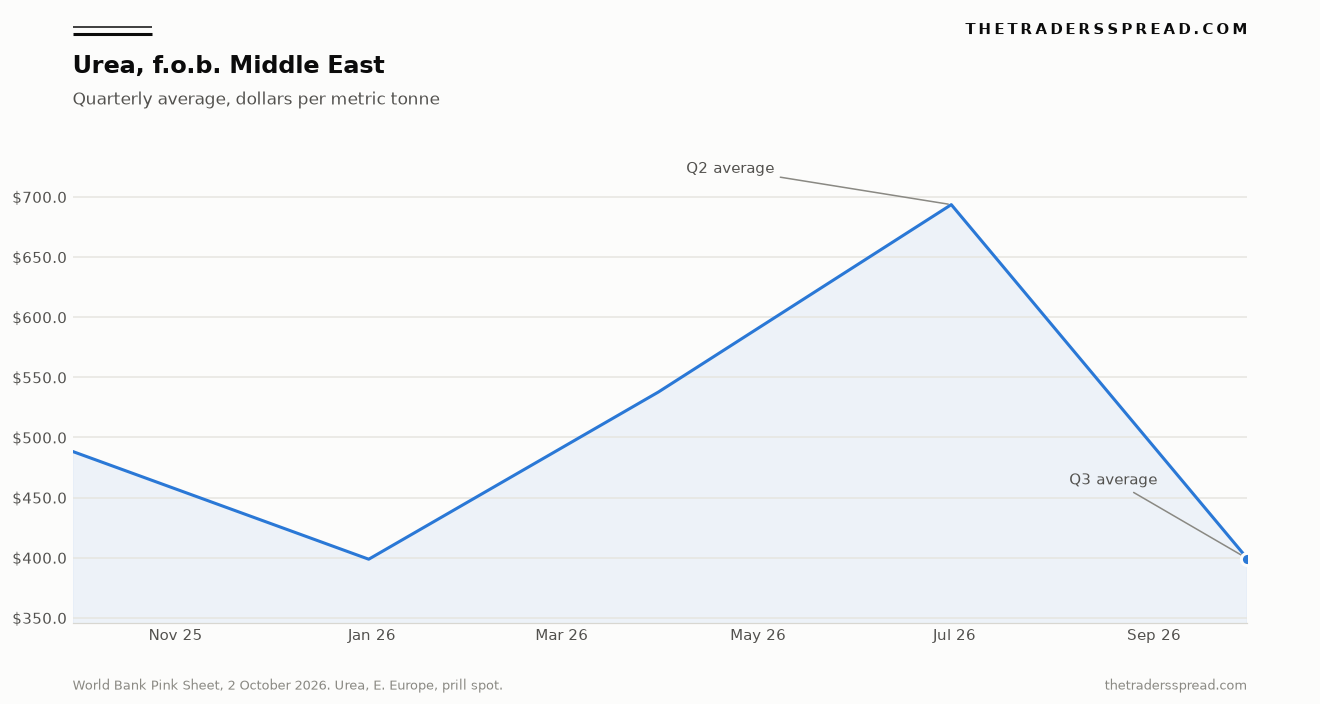
Urea is not still sitting on the spring spike. The prill spot the World Bank labels Urea, E. Europe, f.o.b. Middle East, fell 42.4% from a second-quarter average of $693.50 a metric tonne to a third-quarter average of $399.20, on the pink sheet dated 2 October 2026. The window is April-June against July-September. Inside the quarter the monthly columns read $400.00 in July, $390.00 in August and $407.50 in September. September rose 4.5% from August, a $17.50 bounce, and the quarter still finished $294.30 a tonne under the second-quarter average. John Baffes, Senior Agriculture Economist in the World Bank's Development Economics Prospects Group, and Kaltrina Temaj, Research Analyst in the Prospects Group, wrote on 14 May that nitrogen prices had climbed above $850 a metric tonne in April, up 80% since February and the highest since April 2022. Treating that April line as the price still in force means reading a spike the later official averages have already given back.
The same page refuses the story that cheaper gas did the work. Netherlands TTF natural gas rose from $15.58 per million Btu in the second quarter to $21.53 in the third, a 38.2% increase, while the urea average fell 42.4%. US Henry Hub moved the other way by a little, from $2.95 to $2.87, a 2.7% decline, nowhere near the size of the urea move. On that sheet diammonium phosphate rose 4.3% quarter on quarter and potassium chloride fell 4.8%. Nitrogen's benchmark reset. The rest of the complex did not. Three USDA Agricultural Marketing Service reports for the week ending 16 October, opened for this note, show distributor urea asks in Illinois, Oklahoma and the Pacific Northwest moving by 0% to 0.8%. A flat domestic week is not the same event as a 42.4% quarterly reset in the export benchmark.
Key facts
- Urea, E. Europe prill spot f.o.b. Middle East averaged $399.20 a metric tonne in July-September 2026, down 42.4% from $693.50 in April-June — World Bank Pink Sheet, 2 October 2026
- The September monthly average was $407.50, up 4.5% from $390.00 in August and up from $400.00 in July — World Bank Pink Sheet, 2 October 2026
- European TTF gas averaged $21.53 per million Btu in the third quarter, up 38.2% from $15.58 in the second — World Bank Pink Sheet, 2 October 2026
- Potassium chloride, granular spot CFR Brazil, averaged $383.60 in the third quarter, down 4.8% from $402.90 — World Bank Pink Sheet, 2 October 2026
- DAP, spot f.o.b. US Gulf, averaged $791.80 in the third quarter, up 4.3% from $759.50 — World Bank Pink Sheet, 2 October 2026
- Illinois distributor urea (46-0-0) asked $770.00 a ton on average in the week ending 16 October 2026, unchanged on the prior report — USDA AMS Illinois Production Cost Report, 16 October 2026
- The unweighted mean of the three 2026 quarterly urea averages on the sheet is $543.47 a tonne, 28.6% above the 2025 annual average of $422.70 — World Bank Pink Sheet, 2 October 2026
Same sheet, four fertilisers
The pink sheet dated 2 October 2026 is a single grid. Annual columns cover 2023, 2024 and 2025. Quarterly columns run from July-September 2025 through July-September 2026. Monthly columns cover only July, August and September 2026. Urea sits on the row the footnotes describe as prill spot f.o.b. Middle East, published under the label Urea, E. Europe. The number in the title is not a daily assessment and not a US farm invoice. It is ($693.50 minus $399.20) divided by $693.50.
That is 42.4%.
Read across the fertiliser block and the quarter stops looking like one event. DAP rose 4.3% and its September cell was $800.60. TSP was nearly flat on the quarter, then September fell to $690.00. Potassium chloride fell 4.8% on the quarter and another 5.0% from August to September, to $367.50. Urea's quarterly drop is much larger than the potash move, and it has the opposite sign from DAP.
| Series on the 2 October 2026 pink sheet | Apr-Jun 2026 | Jul-Sep 2026 | Quarter change | September 2026 |
|---|---|---|---|---|
| Urea, E. Europe, prill, f.o.b. Middle East ($/mt) | 693.50 | 399.20 | down 42.4% | 407.50 |
| DAP, spot, f.o.b. US Gulf ($/mt) | 759.50 | 791.80 | up 4.3% | 800.60 |
| Potassium chloride, CFR Brazil ($/mt) | 402.90 | 383.60 | down 4.8% | 367.50 |
| TSP, spot, import US Gulf ($/mt) | 702.40 | 704.60 | up 0.3% | 690.00 |
| Natural gas, Europe, TTF ($/mmBtu) | 15.58 | 21.53 | up 38.2% | 25.42 |
| Natural gas, US, Henry Hub ($/mmBtu) | 2.95 | 2.87 | down 2.7% | 2.95 |
| Wheat, US HRW, Gulf ($/mt) | 290.30 | 329.00 | up 13.3% | 347.00 |
All seven rows are taken from the World Bank pink sheet dated 2 October 2026. Quarter changes are computed from those printed averages. Potassium chloride is a peer row, not a retitle of this note. A separate potash piece on this site is a different commodity and a different exercise.
The urea row also has a memory inside the same grid. The 2023 annual average was $358.00. The 2024 annual average was $338.30. The 2025 annual average was $422.70. The third quarter of 2025, one year before this print, was $488.30, so the latest quarter is 18.2% under the year-ago quarter. The fourth quarter of 2025 was $398.70. The third quarter of 2026, at $399.20, landed $0.50 above that cell, a difference of 0.1%. The first quarter of 2026 had already stepped up to $537.70. The second quarter then printed $693.50. The third gave that step back and sat on the late-2025 quarterly neighbourhood.
Average the three 2026 quarterly cells and the year-to-September picture is not the September picture. (537.70 + 693.50 + 399.20) / 3 = $543.47. Because each quarter on this sheet spans three months, that mean is the January-to-September average. It sits 28.6% above the 2025 annual average of $422.70. September alone, at $407.50, sits 3.6% under that 2025 annual average, and 20.5% above the 2024 annual average of $338.30. The two windows point in different directions. Both are arithmetic.
Gas rose while the urea average fell
Baffes and Temaj, in that 14 May note, tied the spring surge to export disruptions after the closure of the Strait of Hormuz. They wrote that the Middle East accounts for nearly a quarter of global urea exports, that Iran halted ammonia production, that Qatar suspended urea output after damage to facilities, and that India cut urea output because LNG supplies were lower. They called natural gas the main production cost for nitrogen fertilisers. The note projected urea prices would rise nearly 60% in 2026 before easing in 2027, with risks tilted up if shipping disruptions ran past the third quarter.
The 2 October sheet is the later record, not a revision of their April description. It does not print a cause in the urea row. What it does print is the cost series beside the product series. TTF, the Netherlands Title Transfer Facility, is the Europe gas row: $15.58 in the second quarter, $21.53 in the third, then $18.06 in July, $21.11 in August and $25.42 in September. September gas was 20.4% above August. September urea was 4.5% above August. Over the quarter, gas up 38.2% and urea down 42.4% cannot be the same shock seen from two angles.
A model that says "nitrogen follows TTF" fails this particular window. Our TTF gas note is a separate page with its own horizon. It is linked here only because the feedstock and the product diverged on one official grid, not because that note's levels belong in this record.
Henry Hub did not rescue the gas story. The US natural gas row fell from $2.95 in the second quarter to $2.87 in the third. July was $2.89, August $2.77, September $2.95. August to September was a 6.5% rise in the US gas cell, back to the second-quarter average, while urea's monthly cell rose 4.5% and remained near $400. A 2.7% quarterly dip in Henry Hub is real and small. It is not a 42.4% move. The Henry Hub note on this site covers that US series on its own terms.
Distributor asks in the week to 16 October
USDA AMS production-cost reports are a different object. They collect distributor asking prices, sale type Ask, freight basis F.O.B., in dollars per ton, for a named week. They are not the World Bank's metric-tonne prill assessment, and this note does not convert one into the other. The explanatory notes never say the ton is metric. Subtracting $399.20 from $770.00 would pretend the units match.
For the week ending 16 October 2026, the Illinois Production Cost Report put urea (46-0-0) at an average ask of $770.00 a ton, range $650.00 to $890.00, change 0.00. The weekly move is 0%. Liquid nitrogen 32-0-0 on the same page rose $10.00 to $540.00, about 1.9% on an implied prior of $530.00. The largest nitrogen change in that file still sat under 2%.
The Oklahoma Production Cost Report for the same week put urea (46-0-0) at $638.08, range $585.00 to $775.00, change down $5.20. The implied prior average is $643.28. The move is 0.8% lower. The ask eased. It did not reprice.
The Pacific Northwest Production Cost Report put urea (46-0-0) at $1,094.25, range $857.00 to $1,350.00, change up $8.65. The implied prior is $1,085.60. The move is 0.8% higher. The top of that range sits so far above the bottom that the average is a poor stand-in for any single warehouse.
| USDA AMS report, week ending 16 October 2026 | Urea average, $/ton | Change | Implied prior | Move |
|---|---|---|---|---|
| Illinois | 770.00 | 0.00 | 770.00 | 0% |
| Oklahoma | 638.08 | down 5.20 | 643.28 | down 0.8% |
| Pacific Northwest | 1,094.25 | up 8.65 | 1,085.60 | up 0.8% |
None of these three weekly moves clears 2%. That is why the headline uses the pink-sheet quarter and not the domestic week. Dressing a 0% Illinois change as the news would mis-state the file.
The gap between a $399.20 f.o.b. Middle East quarterly average and a $770 Illinois ask is a chain, not a rounding error. Chris Bohn, President and CEO of CF Industries, said on the 6 August 2026 call that freight from the Middle East to the Gulf was about $70, against about $35 a year earlier. Adding that $70 to the September cell is a sketch of one seaborne leg, about $477.50, not an Illinois price and not a level this note sets. Bert Frost, Executive Vice President and Chief Commercial Officer at CF Industries, said on the same 6 August call that the market had come off the second-quarter highs and was, that day, in a $600 to $700 range depending on destination. The pink sheet's September f.o.b. cell, published later, is $407.50. Those figures meet only if someone forces one basis onto both.
Interior asks can stay high after an export benchmark has already fallen. The week of 16 October is evidence of that lag in three regions, not evidence that the benchmark failed to fall. A merchant quoting $770 in Illinois and a merchant quoting $407.50 f.o.b. Middle East in September are not disagreeing about a fact. They are pricing different points, on different calendars, in units this note refuses to mash together.
September rose 4.5%, and the wheat ratio compressed
The monthly turn is easy to over-read. From August's $390.00 to September's $407.50 is $17.50, which is 4.5%. From July's $400.00 to August's $390.00 was a 2.5% dip. The quarter's low monthly print is August, not September, and September did not get back to the second-quarter average or to the April area above $850. A 4.5% monthly rise after a 42.4% quarterly fall is a turn inside a reset. It is not a new spike.
Wheat moved the other way, which changes the ratio even if a reader never looks at gas. US hard red winter wheat, the Gulf export price on the same sheet, averaged $290.30 in the second quarter and $329.00 in the third, up 13.3%, with September at $347.00. Divide urea by wheat, both in dollars per metric tonne: 693.50 / 290.30 is 2.39 tonnes of HRW wheat per tonne of urea in the second quarter, and 399.20 / 329.00 is 1.21 in the third. September is 407.50 / 347.00, or 1.17. The ratio compressed because the numerator fell and the denominator rose. Our wheat piece is about a different window. The ratio here uses only the 2 October grid.
That ratio is not a US invoice. The Illinois ask of $770 a ton in the week of 16 October did not move. Mixing a September f.o.b. Middle East urea cell with that Illinois ask, then dividing by Gulf wheat, would produce a figure this sheet does not contain.
DAP's September cell of $800.60, still rising, means a phosphate user did not get the nitrogen user's quarterly relief. Potash's September cell of $367.50, down 5.0% on the month, is a milder and later move than urea's quarterly collapse. The complex did not share one percentage. Reporting "fertiliser fell 42%" would be false on this page. Urea did. DAP did not.
RelatedAlumina Price Prediction: $430 Bull Case vs $280 Bear
What this changes
The operative quarterly average for this benchmark is $399.20, not the April area above $850. A desk still marking urea off the May note's spike is one quarter late. The nine-month average of $543.47 keeps the first half in the year, so "urea is back to 2025" is wrong if it is aimed at January through September. It is closer to fair for September alone, which at $407.50 sits 3.6% under the 2025 annual average of $422.70. Say which window.
The domestic week does not inherit the quarterly percentage. Illinois was unchanged at $770.00 a ton. Oklahoma was down 0.8% at $638.08. The Pacific Northwest was up 0.8% at $1,094.25, inside a $857 to $1,350 range. None of those files supports a headline that US distributor urea repriced in the week to 16 October. A reader holding a US invoice who cites 42.4% is citing the wrong market.
Gas is the wrong one-line cause for this particular fall. TTF rose 38.2% from the second quarter to the third, and another 20.4% from August to September. Henry Hub's quarterly dip was 2.7%. The May note was right to treat gas as the main production cost in general. The October grid shows that cost and this price moving apart in the quarter the spike was given back.
Potash is not a substitute sentence. It fell 4.8% on the quarter, on a CFR Brazil granular row, and DAP rose. Nitrogen's benchmark reset. Phosphate's did not. Potash eased by a few percent. The peer cell does not borrow the urea percentage, and it does not belong to the separate potash page on this site.
September's 4.5% rise says August was the low monthly print of the quarter. It does not say where October will print. The next pink-sheet month, and the next AMS change column, are the records that can move this description. Until those pages exist, the dated facts are 42.4% down from the second-quarter average to the third, 4.5% up from August to September, and a US asking-price week that did not clear 2%.
Questions the prints raise
What urea price did the World Bank print for the third quarter of 2026?
The 2 October 2026 pink sheet puts Urea, E. Europe, prill spot f.o.b. Middle East, at $399.20 a metric tonne for July-September 2026. The prior quarter, April-June, is $693.50. The fall is $294.30, or 42.4%. The row is a quarterly average, not a daily close and not a US distributor ask. The same row's September monthly average is $407.50.
Did the urea price rise in September 2026?
Yes, on the monthly columns of that sheet. September averaged $407.50, against $390.00 in August and $400.00 in July. August to September is a rise of $17.50, or 4.5%. July to August was a 2.5% dip. The monthly rise does not undo the quarterly fall. September remains far under the second-quarter average of $693.50 and under the April area above $850 described in the World Bank's 14 May note.
Are the USDA asks the same series as the Middle East benchmark?
No. For the week ending 16 October 2026 the Illinois, Oklahoma and Pacific Northwest reports print distributor asks in dollars per ton. Urea averaged $770.00, $638.08 and $1,094.25 in that order. The weekly moves are 0%, down 0.8% and up 0.8%. The reports do not convert onto the pink sheet's metric-tonne basis, so this note does not subtract one series from the other.
Did potash fall by the same percentage as urea?
No. Potassium chloride, granular spot CFR Brazil, fell from $402.90 in the second quarter to $383.60 in the third, a 4.8% decline, and September was $367.50, down 5.0% from August. DAP rose 4.3% on the quarter, to $791.80, and September was $800.60. TSP was nearly unchanged on the quarter, at $704.60. Urea's 42.4% quarterly drop is the outlier on the fertiliser block, not the template for the block.
If European gas rose, how can the urea average have fallen?
Both moves are on the 2 October sheet. TTF rose from $15.58 per million Btu to $21.53, up 38.2%, and September TTF was $25.42. Henry Hub eased from $2.95 to $2.87. The May note called gas the main nitrogen cost and tied the spring spike to export disruptions around Hormuz. The later grid shows the urea average giving that spike back while European gas was still rising. It does not name one cause for the fall.
This is analysis, not advice. Capital is at risk. The figures are a record of pages opened for this note, the World Bank pink sheet dated 2 October 2026 and three USDA AMS reports for the week ending 16 October 2026, plus named remarks from a 14 May World Bank note and a 6 August CF Industries call. They are not a recommendation to transact, and they are not a level for the next print.