

Are Newcastle coal and API2 the same seaborne thermal market with a freight wedge between them, or two prices answering two different basins? The listed contracts give a sharper answer than a blended front-month screen. On a delayed quote retrieved 9 November 2026, November 2026 Newcastle stood at 140.90 USD a tonne and November 2026 API2 at 134.05, a same-month gap of 6.85 USD. December 2027 stood at 140.80 against 123.90, a gap of 16.90 USD. The premium widens along the strip because later API2 months are priced lower, while Newcastle stays near 141.
The continuous symbols hide that split. ICEEUR:NCF1! was December 2026 Newcastle at 141.10, and ICEEUR:ATW1! was still November 2026 API2 at 134.05. Subtracting those screens mixes delivery months. The mixed gap is 7.05 USD, close to the matched front gaps and still a cross-month pair. Anyone looking up the Newcastle coal price needs the month, the port, and the index attached to the print.
Updated 9 November 2026.
Key facts
- Newcastle coal December 2026, symbol NCFZ2026, last 141.10 USD a tonne, session high 145.00, volume 259 lots. Source: TradingView delayed scanner, ICEEUR, retrieved 9 November 2026.
- API2 November 2026, symbol ATWX2026, last 134.05 USD a tonne, open 137.25, volume 62 lots. Source: TradingView delayed scanner, ICEEUR, retrieved 9 November 2026.
- Same-month gap, Newcastle minus API2, 6.85 USD for November 2026 and 16.90 USD for December 2027. Source: TradingView delayed scanner, retrieved 9 November 2026.
- World Bank Australian coal, defined as FOB Newcastle 6,000 kcal/kg futures, monthly average 152.30 USD a tonne for October 2026. Source: World Bank Pink Sheet monthly workbook, updated 3 November 2026.
- Trading Economics series XAL1:COM printed 140.90 USD a tonne on 6 November 2026, a daily change of minus 2.46 percent. Source: Trading Economics coal page, retrieved 9 November 2026.
- Each ICE contract is 1,000 metric tonnes of thermal coal, quoted in US dollars a tonne, with a 0.05 USD minimum move and financial settlement. Source: ICE Futures Europe contract specifications, PDFs retrieved 9 November 2026.
Two thermal contracts, two delivery points
Both are thermal coal futures on ICE Futures Europe, and the resemblance stops there. The globalCOAL Newcastle Coal Futures contract, product 1137, symbol NCF, settles on coal loaded at the Newcastle Coal Terminal against the globalCOAL Monthly NEWC Index. ICE describes that index as the average of each Friday weekly reading, and each Friday blends transaction prices with bids and offers. In a busy window the future itself settles on the 16:05 to 16:15 London weighted average, with quoted settlement prices if the window is thin. Trading ceases at 12:00 London time on the last Friday of the month. The lot is 1,000 tonnes, the tick is 5 cents, and the maximum fluctuation is recorded as unlimited. Strips cover months, quarters, and six calendar years.
API2 Rotterdam Coal Futures, product 243, symbol ATW, settle on coal delivered into Amsterdam, Rotterdam, and Antwerp against the API 2 Index in the Argus/McCloskey report. Size and the 5 cent tick match Newcastle. Expiry is the last Friday of the month, or the prior business day when that Friday is a holiday. API2 also lists six seasons, April-September and October-March, which the Newcastle specification leaves off its page. Both pages show ICE Clear Europe and MIC IFEU. globalCOAL.com returned HTTP 403 and the Argus coal page came back empty, so the recipes here are the ICE specifications retrieved 9 November 2026. Calorific value is cited only where the World Bank note defines a column.
| Term | Newcastle, NCF | API2, ATW |
|---|---|---|
| ICE product | 1137, globalCOAL Newcastle Coal Futures | 243, API2 Rotterdam Coal Futures |
| Delivery | Loaded at the Newcastle Coal Terminal, Australia | Delivered Amsterdam, Rotterdam, and Antwerp |
| Cash index | globalCOAL Monthly NEWC Index | API 2 Index, Argus/McCloskey report |
| Size and tick | 1,000 metric tonnes, 0.05 USD | 1,000 metric tonnes, 0.05 USD |
| Expiry | 12:00 London time, last Friday of the month | Last Friday, or the prior business day if that Friday is a holiday |
| Listed strips | Months, quarters, calendar years | Months, quarters, seasons, calendar years |
| Screen settlement | 16:05 to 16:15 London average, or quoted settlement prices | Cash settled to the API 2 Index |
The gap along the listed months
A fair comparison holds the delivery month fixed and subtracts API2 from Newcastle. The quotes below are a delayed TradingView scanner read of the named ICEEUR contracts on 9 November 2026, in USD a tonne. Volume is in lots, and each lot is 1,000 tonnes, so 259 lots equal 259,000 tonnes. On several later months the open, high, and low equal the last price while volume is still reported, which fits a thin tape or a single print. The level is the listed price, and the next trade can revise it.
| Delivery | Newcastle | API2 | Gap | Newcastle lots | API2 lots |
|---|---|---|---|---|---|
| Nov 2026 | 140.90 | 134.05 | 6.85 | 142 | 62 |
| Dec 2026 | 141.10 | 133.55 | 7.55 | 259 | 765 |
| Jan 2027 | 142.00 | 132.35 | 9.65 | 109 | 376 |
| Feb 2027 | 141.85 | 130.65 | 11.20 | 104 | 289 |
| Mar 2027 | 141.70 | 129.25 | 12.45 | 109 | 274 |
| Apr 2027 | 140.90 | 128.65 | 12.25 | 32 | 96 |
| May 2027 | 140.45 | 127.75 | 12.70 | 31 | 96 |
| Jun 2027 | 140.40 | 126.90 | 13.50 | 31 | 96 |
| Jul 2027 | 140.60 | 126.50 | 14.10 | 20 | 79 |
| Aug 2027 | 140.80 | 126.35 | 14.45 | 20 | 79 |
| Sep 2027 | 140.80 | 126.55 | 14.25 | 20 | 79 |
| Oct 2027 | 141.00 | 126.80 | 14.20 | 15 | 84 |
| Nov 2027 | 140.90 | 126.10 | 14.80 | 15 | 83 |
| Dec 2027 | 140.80 | 123.90 | 16.90 | 15 | 83 |
Newcastle on the strip runs from 140.40 in June 2027 to 142.00 in January 2027, a band of 1.60 USD. API2 falls from 134.05 to 123.90, a drop of 10.15 USD. The gap widens by 10.05 USD, from 6.85 to 16.90, and almost all of that widening is the European leg. January is the firmest Newcastle month. December 2027 is the widest gap.
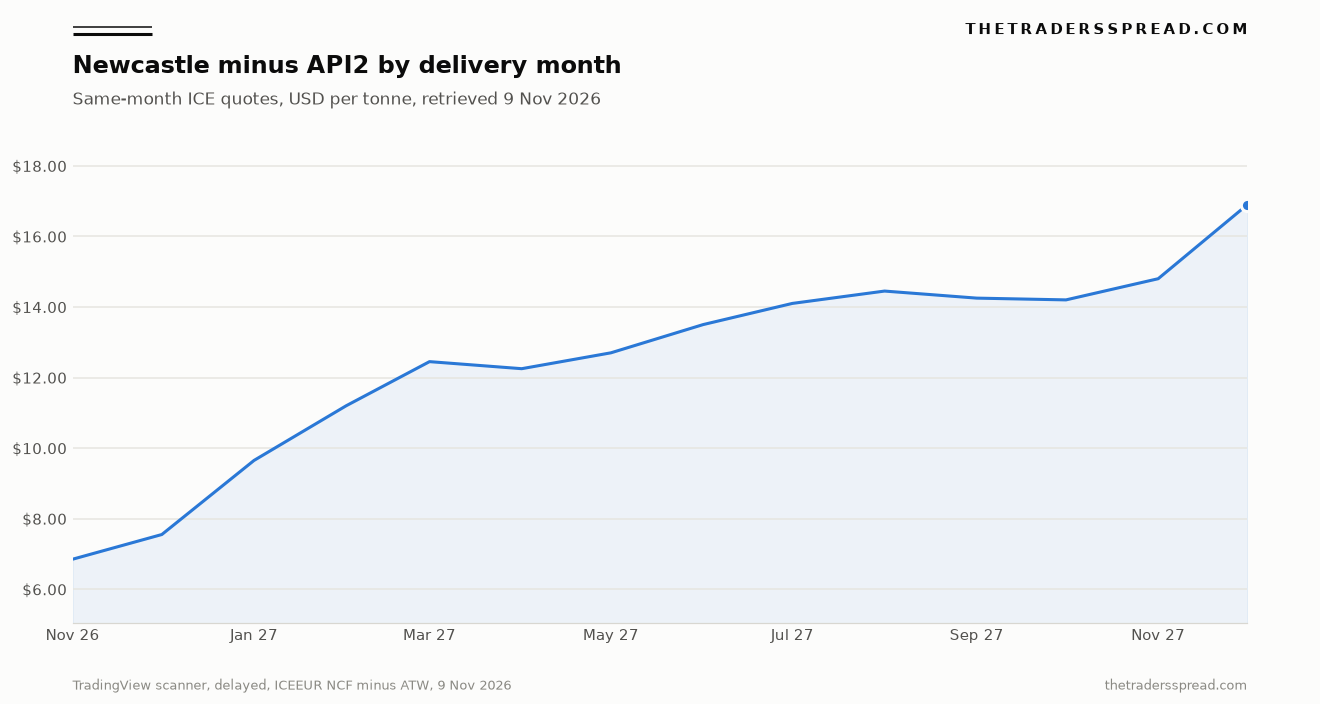
The chart is that gap by delivery month, a 9 November 2026 snapshot, so the axis is tenor rather than a history of the rolling front. December API2 volume was 765 lots, or 765,000 tonnes, against 62 lots in November. Newcastle's busier nearby month was also December, 259 lots against 142. The continuous API2 symbol was the thinner November contract, 0.50 USD above December and 0.70 USD tighter against Newcastle.
What the trailing returns show
The pages for ICEEUR:NCF1! and ICEEUR:ATW1! print a performance strip beside the quote. The one-day figures match the scanner's percentage change on December Newcastle and November API2. Longer windows are the rounded figures on those pages. They follow the continuous symbols, and on this date those symbols were different delivery months, so the trail belongs to the rolling benchmark.
| Window | Newcastle NCF1! | API2 ATW1! |
|---|---|---|
| 1 day | −2.66% | −2.37% |
| 5 days | −7.17% | −8.50% |
| 1 month | −6.25% | −7.90% |
| 3 months | 9.81% | 14.57% |
| 6 months | 3.67% | 23.89% |
| Year to date | 33.43% | 37.56% |
| 1 year | 24.10% | 38.55% |
| 5 years | −7.90% | −7.87% |
| 10 years | 28.62% | 52.33% |
Over six months API2 was up 23.89 percent and Newcastle 3.67 percent. One year reads 38.55 percent against 24.10 percent, and ten years 52.33 percent against 28.62 percent, while five years are almost twins at minus 7.90 and minus 7.87 percent. The latest five days were shared, minus 7.17 and minus 8.50 percent. The front dip is common, and the larger six-month and one-year move sat in API2. That path is separate from the afternoon's term structure, where API2 is lower in later months and Newcastle holds near 141.
What actually sets the gap
Four things sit inside the subtraction, and only one of them is a live freight invoice.
Newcastle prices coal loaded in Australia. API2 prices coal delivered into Northwest Europe, so the voyage sits inside the European number. A Newcastle-to-ARA freight assessment was outside the pages opened here. Dry-bulk hire is its own market, which is why the desk's explainer of what the Baltic Dry Index measures treats ship class and hire separately. The coal gap also contains quality, timing, and regional balance.
The cash indexes use different clocks. Newcastle settles to a monthly average of Friday globalCOAL readings that mix trades with bids and offers, while API2 settles to the Argus/McCloskey API 2 assessment. A futures print is the order book, and the cash figure that settles the contract is built on another calendar, so the future and its own index can part company inside the delivery month. Two publishers can move a settlement by more than a tick even when the cargo looks similar.
Tenor is the part the table measures. From November 2026 to December 2027, Newcastle stays inside 140.40 to 142.00 while API2 falls from 134.05 to 123.90. A flat Pacific curve against a downward European curve is the shape on this date. Later sessions will replace the levels. The habit that survives is to line the month up, then see which leg moved.
Australian loadings are priced for Pacific buyers. ARA delivery is priced for Northwest Europe, where gas is the other flexible power fuel, so a gas move reaches API2 more directly than a Newcastle loading price. A spark spread stays out of scope because a European gas series was a different dataset. The desk's note on the JKM LNG settlement is an Asian LNG benchmark, a third basin, and a reminder that gas itself is more than one price.
Metallurgical coal is a further commodity, sold into blast furnaces. The desk has covered a coking-coal survey move, and those prices belong to steel, which makes them the wrong yardstick for either thermal benchmark. API2 taken alone has a separate desk page. The tables here keep to the thermal spread, free of a target on either leg.
Three Newcastle numbers, and a third port
The phrase Newcastle coal price landed on three different objects in the pages opened for the session. They can sit together only while each one keeps its label.
The World Bank monthly workbook, updated 3 November 2026, puts Australian coal at 152.30 USD a tonne for October. From February 2022 the note defines that column as FOB Newcastle thermal coal, 6,000 kcal/kg, on a futures basis. Earlier years used a spot price and, before that, a 6,300 kcal gross-as-received price at Newcastle and Port Kembla. October's average sits above the early-November futures after the selloff. The file is linked from the Bank's commodity markets page.
| Month | World Bank Australian coal, USD/mt |
|---|---|
| Jan 2026 | 109.80 |
| Feb 2026 | 118.40 |
| Mar 2026 | 138.60 |
| Apr 2026 | 130.90 |
| May 2026 | 136.90 |
| Jun 2026 | 138.50 |
| Jul 2026 | 131.90 |
| Aug 2026 | 135.20 |
| Sep 2026 | 147.10 |
| Oct 2026 | 152.30 |
Trading Economics shows ticker XAL1:COM as OTC and CFD trading that tracks the benchmark, and it names the 1,000 tonne ICE Newcastle contract as a widely referenced market. The dated print is 140.90 USD a tonne on 6 November 2026, down 2.46 percent on the day, down 6.22 percent on the month, and up 27.57 percent on the year. That print matches the November Newcastle future to the cent and sits 6.85 USD above November API2. The year change is near Newcastle's continuous 24.10 percent and apart from API2's 38.55 percent. The page's all-time high is 457.80 in September 2022, on a CFD series it separates from an exchange settlement.
RelatedRobusta vs Arabica on Volatility, Stocks and Hours
The same workbook prints South African coal at 100.00 USD a tonne for October 2026, defined since January 2015 as FOB Richards Bay, 6,000 kcal/kg net as received, sulphur under 1 percent. That is an API4-family loading benchmark, a third port. October's 152.30 against 100.00 is a gap between two FOB monthly averages, wider than the November Newcastle-API2 futures gap, on different delivery terms. Treating 100 as API2 mixes three benchmarks. API2 is absent from these coal headers, which is why the curve comes from the ICE contracts.
FAQ
What is the Newcastle coal price contract?
The exchange contract is globalCOAL Newcastle Coal Futures, symbol NCF, product 1137 on ICE Futures Europe. It settles on thermal coal loaded at the Newcastle Coal Terminal in Australia, in lots of 1,000 metric tonnes. Cash settlement follows the globalCOAL Monthly NEWC Index, the average of Friday weekly indexes that blend trades with bids and offers. The screen price during the month is the futures market. The settling figure is that monthly average.
What is API2?
API2 here is ICE Rotterdam Coal Futures, symbol ATW, product 243. It settles financially on thermal coal delivered into Amsterdam, Rotterdam, and Antwerp, against the API 2 Index in the Argus/McCloskey Coal Price Index Report. The lot is 1,000 metric tonnes and the minimum move is 5 US cents. Delivery is Northwest Europe, and the index publisher is a different house from globalCOAL. The contract also lists seasonal strips of six months.
Why do Newcastle coal and API2 differ?
The gap holds delivery basis, index recipe, tenor, and basin. Newcastle prices coal loaded in Australia. API2 prices coal delivered into Northwest Europe, so the voyage sits inside the European number. The cash indexes come from different publishers on different calendars. On the 9 November 2026 read the same-month gap was 6.85 USD for November and 16.90 USD for December 2027, with API2 lower at later dates. A Newcastle-to-ARA freight quote was a separate source.
Which contract month should a comparison use?
Use the same delivery month on both symbols. On 9 November 2026 the continuous Newcastle symbol was December at 141.10, and the continuous API2 symbol was November at 134.05. The mixed subtraction was 7.05 USD. The matched November gap was 6.85 and the matched December gap was 7.55, with later months wider, out to 16.90 in December 2027. Swapping the month answers a different question.
What does the gap say about taking a side?
On this delayed read Newcastle was quoted above API2, by 6.85 to 7.55 USD on the matched front months and by 16.90 USD for December 2027, because the API2 strip sloped down while Newcastle held. Over one year the continuous API2 contract rose 38.55 percent against Newcastle at 24.10 percent. Those figures describe the quotes and the trailing returns. The next session can reprice either leg. The spread shows the basins and the tenor, and it stops there.
What the gap is saying
On 9 November 2026 the gap says the two benchmarks were doing different jobs. Matched Novembers were 6.85 USD apart and matched Decembers 7.55 USD apart. By December 2027 the gap was 16.90 USD, almost all of it a lower API2 price, 123.90 against Newcastle at 140.80. Over the trailing year continuous API2 rose 38.55 percent against Newcastle at 24.10 percent, even with both lower over the latest week. The premium is a delivery-point and tenor spread between an Australian loading benchmark and a Northwest European delivered benchmark, a description of the quotes rather than a direction for the next session. Keep the month, the port, and the index on any figure called the Newcastle coal price.
This page is general market information for education. It carries no personal instruction to buy, sell, or hold a commodity or a futures contract, and it sets no price target.