

We keep the gallium file open on this desk because the price cell and the production cell answer different questions, and mixing them up prices the wrong object. The sheet we reopened is the U.S. Geological Survey Mineral Commodity Summaries chapter on gallium, February 2026, with figures in kilograms of gallium content unless a line says otherwise. The price line is an average customs value of metal that entered the United States. The production line is primary low-purity output, recovered while someone else was processing bauxite or, in a smaller stream, zinc.
USGS states that China accounted for 99% of worldwide primary low-purity gallium production, and the 2024 cells print China at 839,000 kilograms out of a rounded world total of 848,000. Over 2021 through 2024, China supplied 18% of US gallium metal imports, behind Canada at 28% and Japan at 22%, with Germany at 16% and other origins at 16%. In 2025 the estimated value of those metal imports was $15 million, while estimated gallium arsenide wafer imports were worth $120 million.
Updated 4 November 2026, after we reopened the USGS gallium sheet and the Ministry of Commerce announcements cited below.
Key facts
- US average customs unit value of gallium metal was an estimated $580 per kilogram in 2025, against $439 in 2024, $365 in 2023, $432 in 2022, and $277 in 2021. Source: USGS Mineral Commodity Summaries, Gallium, February 2026, citing Census data for tariff code 8112.92.1000.
- China's primary low-purity output was 839,000 kilograms in 2024 and an estimated 900,000 kilograms in 2025, against rounded world totals of 848,000 and 900,000 kilograms. USGS states China accounted for 99% of that primary production. Source: USGS Mineral Commodity Summaries, Gallium, February 2026.
- US net import reliance was 100% of reported consumption each year from 2021 through the 2025 estimate. No domestic primary gallium has been recovered since 1987. Source: USGS Mineral Commodity Summaries, Gallium, February 2026.
- Reported US consumption was an estimated 19,000 kilograms in 2025. Integrated circuits accounted for 73% of domestic gallium consumption and optoelectronic devices for 26%. Source: USGS Mineral Commodity Summaries, Gallium, February 2026.
- US gallium metal imports were an estimated 25,000 kilograms in 2025, against 11,000 kilograms in 2024. Gallium arsenide wafer imports, gross weight, were an estimated 110,000 kilograms, against 152,000 in 2024. Source: USGS Mineral Commodity Summaries, Gallium, February 2026.
- MOFCOM Announcement No. 23 of 2023 took effect on 1 August 2023 and requires a licence for listed gallium items. Announcement No. 72 of 2025, dated 9 November 2025, suspends paragraph 2 of Announcement No. 46 of 2024 through 27 November 2026. Source: MOFCOM pages opened 4 November 2026, read with the USGS February 2026 narrative.
A customs average wearing the name of a price
The myth on a trading screen is that gallium has one price, the way a liquid contract has a last trade. Footnote 2 of the February 2026 chapter says the price is the average customs value of US imports of gallium metal. The 2025 cell is an estimate of $580 per kilogram. The narrative calls that about 30% more than the 2024 cell of $439. The cell is a customs average, not a contract price, and the latest year is still marked as an estimate.
Form moves the dollars even when the element is the same. USGS puts the 2025 value of gallium metal imports at an estimated $15 million and gallium arsenide wafer imports at an estimated $120 million. The wafer row is gross weight, the whole slice on the customs form, a poor stand-in for kilograms of gallium atoms. Metal, wafers, and reported consumption stay in separate columns.
Reported consumption stayed between 17,100 and 19,700 kilograms from 2021 through an estimated 19,000 in 2025, while the unit value went from $277 to an estimated $580. A story that the gallium price simply tracks semiconductor demand has a nearly flat quantity to explain. Integrated circuits accounted for 73% of domestic gallium consumption and optoelectronic devices for 26%, covering laser diodes, LEDs, photodetectors, solar cells, and circuits for defense, high-performance computers, and telecommunications.
Substitutes differ by end use, on the same page. Silicon devices compete with gallium arsenide in midtier handset amplifiers and in solar cells, and indium phosphide and helium-neon lasers cover some diode jobs. In many defense applications, USGS says, no effective substitute exists for gallium arsenide and gallium nitride circuits.
Duties on the normal-trade-relations schedule dated 31 December 2025 are 2.8% for undoped gallium arsenide wafers, free for doped wafers, and 3% for gallium metal, beside a climb from $277 to an estimated $580. Other desks already refuse a single price when the form splits, which is the point of the flake-versus-synthetic graphite page. When we quote a gallium price from this sheet, we mean the metal customs average, with the year and the estimate mark attached.
China makes the primary metal, and the US import line tells another story
The second myth says the country that produces primary gallium is the country on the American import document. Primary gallium here means low-purity, unrefined metal, recovered mostly as a byproduct of bauxite and, for the rest, from zinc-processing residues. Bauxite averages 50 parts per million gallium. USGS estimates gallium in world bauxite resources at more than 1 million tons, its unit on that line.
The 2024 primary cells are China 839,000 kilograms, Russia an estimated 6,000, Japan an estimated 3,000, and a dash for the United States. Those three producing figures sum to the rounded world total of 848,000, and China's share of that total is what the chapter calls 99%. For 2025 the sheet estimates China at 900,000 kilograms, Japan and Russia unchanged, and a rounded world total of 900,000.
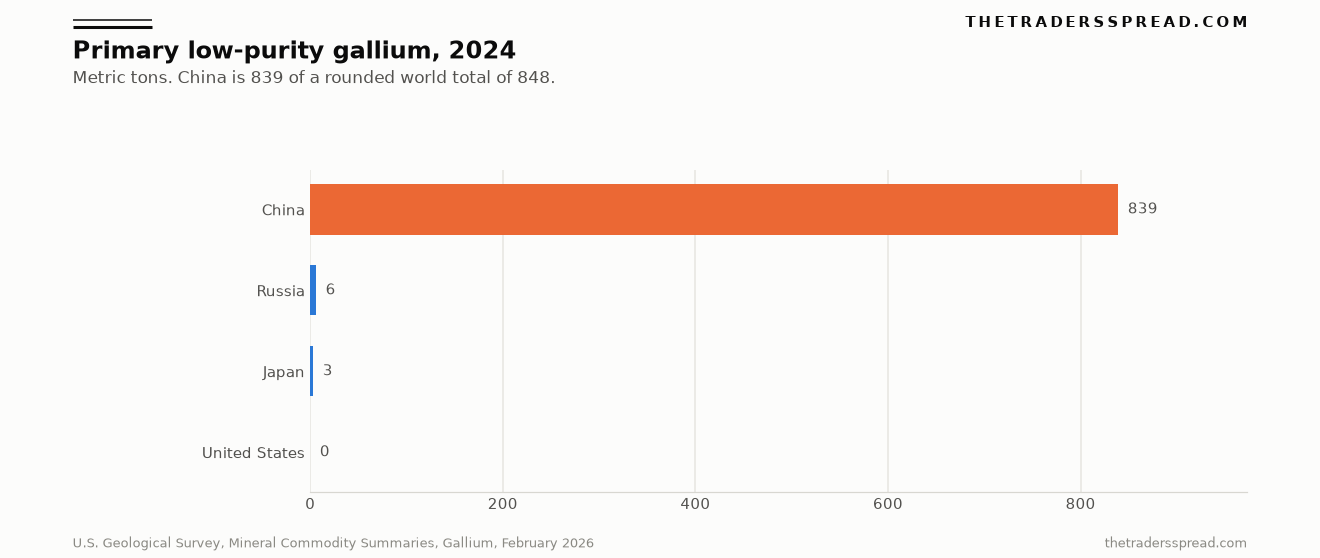
Russia at 6 metric tons and Japan at 3 vanish beside 839, and the US dash is drawn as zero. USGS attributes China's production figures to Asian Metal Ltd. An Asian Metal or Fastmarkets page stayed closed in this session, so the price series here is the Census-based customs average.
On 14 March 2025 the USGS account said its first World Minerals Outlook would project five years of capacity for gallium and six other critical minerals, plus helium. The bars above stay on the Mineral Commodity Summaries production lines.
📣Announcing the inaugural World Minerals Outlook report 📣 This first report provides key projections for the next five years for Helium and 7 critical minerals: Titanium, Platinum, Cobalt, Magnesium, Palladium, Gallium, and Lithium. 👉 https://t.co/AlnwTbXO8J pic.twitter.com/5xdMIQLfUp
— USGS (@USGS) March 14, 2025
For 2025 the sheet estimates China at 1,600,000 kilograms of primary capacity, Japan and Russia at 10,000 each, other countries at 100,000, and a rounded world total of 1,700,000. Nameplate capacity is a separate column, not last year's output. Primary production has already stopped in Germany (2016), Hungary (2015), Kazakhstan (2013), and likely Ukraine (2022). Announced projects in Australia, Canada, Greece, Kazakhstan, and the Republic of Korea still sit outside the production cells.
Refining is where the import puzzle starts. One company in New York recovers high-purity gallium from imported low-purity metal and from new scrap. A kilogram first pulled in a Chinese alumina circuit, refined in Japan, Canada, or New York, then imported, can show a non-Chinese origin on the Census line. The 18% direct China share of US metal imports and the 99% share of primary production count different events.
Most gallium comes from bauxite, and the remainder from zinc residues. Some domestic zinc ores run up to 50 parts per million gallium, with none recovered from domestic ores today. The host metal has its own price logic on the zinc backwardation note. Smelter economics can change whether a residue is worth treating, while the 839,000-kilogram China cell stays a production print.
Year-end US consumer stocks in the table run from 2,810 kilograms in 2021 to an estimated 3,400 in 2025. Dividing 3,400 by the 19,000-kilogram consumption estimate gives 0.18, a little over two months of cover if use were smooth. The government stockpile line is blank on the sheet, and we leave it blank.
How the licence, the prohibition, and the pause sit together
The third myth is that China banned gallium in the summer of 2023 and that every later headline is a footnote. The pages we opened show three layers, and only one of them is a ban.
On 3 July 2023 the Ministry of Commerce and the General Administration of Customs issued Announcement No. 23, effective 1 August 2023. Listed items leave China only with permission. The gallium list has eight entries: metal, nitride, oxide, phosphide, arsenide, indium gallium arsenide, selenide, and antimonide, across the crystal, wafer, powder, and scrap forms the text names. Germanium sits in the same announcement, which is why the germanium price page shares that licence history with a different commodity.
The exporter applies through the provincial commerce authority, and the ministry issues a dual-use licence if it approves. Customs releases against that licence, and shipping outside it is an offense. The August 2023 instrument is a licensing rule with a stated national-security purpose.
The February 2026 narrative, prepared by Emily Schnebele, carries the next layer, because the full text of Announcement No. 46 stayed closed when we tried it. The chapter says China banned all gallium exports to the United States in December 2024, after the August 2023 controls, and lifted that US ban for one year in November 2025. We use those clauses as the survey's summary.
The page we could open is Announcement No. 72, dated 9 November 2025. From that day through 27 November 2026, paragraph 2 of Announcement No. 46 of 2024 is suspended. The paragraph is identified by number. The USGS chapter is what ties it to gallium shipments toward the United States. Announcement 72 leaves the 2023 licence in place.
US metal imports were an estimated 11,000 kilograms in 2024 and 25,000 in 2025, more than double on the narrative's wording. Wafer imports, gross weight, went from 152,000 kilograms to an estimated 110,000, which the narrative calls 24% lower. Dividing those two cells is a steeper drop, and both the 24% and the printed kilograms stay on the page. Metal kilograms rose in the estimate year while wafer gross weight fell.
Before the December prohibition, the 19 November 2024 USGS release modeled a total Chinese ban on gallium and germanium together. It estimates a $3.4 billion hit to US GDP, with more than 40% of the net loss in semiconductor device manufacturing, and says gallium prices could rise more than 150% and germanium prices by 26%, with the lost activity driven mainly by thinner supplies. Nedal Nassar, the lead author, said losing access to minerals that are a fraction of a product's value can still add up to billions across the economy. The 150% figure is that November 2024 scenario. The customs cell later moved from $439 to an estimated $580, beside an estimated $15 million of metal imports.
| US gallium, USGS | 2021 | 2022 | 2023 | 2024 | 2025e |
|---|---|---|---|---|---|
| Metal imports, kilograms | 8,890 | 11,400 | 11,400 | 11,000 | 25,000 |
| GaAs wafers, gross weight, kilograms | 306,000 | 424,000 | 163,000 | 152,000 | 110,000 |
| Reported consumption, kilograms | 17,100 | 19,700 | 17,800 | 18,700 | 19,000 |
| Import unit value, dollars per kilogram | 277 | 432 | 365 | 439 | 580 |
| Consumer stocks, year-end, kilograms | 2,810 | 2,780 | 3,340 | 3,410 | 3,400 |
| Net import reliance, percent | 100 | 100 | 100 | 100 | 100 |
Primary US production is a dash in every column, so it stays off the table. Net import reliance is imports minus exports, excludes gallium arsenide wafers, and shows exports as unavailable. The 100% figure is a metal-balance statement, and a wafer contract needs the wafer row.
Recovery projects beside a 19,000-kilogram consumption print
The fourth myth is that a funded pilot reorders the producer table. USGS records old scrap at none. Substantial new scrap from gallium arsenide device manufacture is reprocessed to high-purity metal at one plant in New York, a loop that stays inside the factory. Phones already sold stay outside it.
On 15 September 2025 the Department of Energy announced up to $6 million for TRACE-Ga, aimed at aluminum and zinc streams. The notice asks for at least 50 kilograms of pure gallium from one 14-day campaign, and a prototype of at least 1 metric ton a year. Tala Goudarzi, Principal Deputy Assistant Secretary, said the United States had gone nearly four decades without recovering primary gallium. Spread 19,000 kilograms of reported consumption over 365 days and the daily rate is about 52 kilograms, so a 50-kilogram campaign is a pilot on the order of one day's use, stretched over two weeks. One metric ton a year is 1,000 kilograms, about 5% of that US consumption cell and about 0.1% of the 900,000-kilogram world primary estimate.
RelatedJKM LNG rises 2.51 percent on the latest settlement
The Department of Energy posted the same effort on 15 October 2025. The post is silent on kilograms already produced.
A new gallium recovery effort by @FECMgov was launched to help strengthen the domestic supply chain of critical minerals.
— U.S. Department of Energy (@ENERGY) October 15, 2025
Gallium—a critical material used in semiconductors, telecommunications, and advanced manufacturing—will be critical in helping advance American energy…
On 14 April 2026 the department said it had selected five organizations for approximately $5.4 million under the same banner. The selection note says funding follows negotiation, negotiations can be cancelled, and amounts can change. The five are PHNX Materials in San Leandro, Atlantic Alumina in Gramercy, Found Energy in Charleston, Kunin Technologies in Chattanooga on a 12-ton-per-annum pathway, and Indium Corporation in Clinton, New York, on scrap. Read as metric tons, that 12-ton pathway is 12,000 kilograms and still sits inside one year of US consumption.
The same chapter records $29.9 million under Defense Production Act Title III, from the department the sheet calls the Department of War, for a Louisiana demonstration plant recovering gallium and scandium from industrial waste, with initial work expected in Texas. The defense release failed to open from our desk on 4 November 2026, so the company name stays off this page. The February 2026 primary cell for the United States is still a dash.
What would change our mind
Our producer ranking, from the 2024 primary cells, is China, then Russia, then Japan, then the United States at zero. A new figure changes it when the figure is primary low-purity output for a named country and a stated year, in a later USGS summary or a plant report we can tie to a company. China loses the top line only above 839,000 kilograms from someone else. Russia loses second place above 6,000 kilograms. Japan loses third above 3,000 and still below Russia. The United States leaves the bottom when the primary cell stops being a dash.
Canada leads 2021-24 metal import sources at 28%. A later multi-year Census share, the series behind the USGS line, reorders origins if Japan, China, Germany, or another source prints above Canada. The unit value can leave $580 without touching either ranking. The policy date we would re-read is 27 November 2026, the end date in Announcement 72. A later ministry text that extends the pause, replaces it, or lets paragraph 2 of Announcement 46 operate again would change the licence column. Production rank still waits on the next output cells, and China's 1,600,000 kilograms of capacity moves the ranking only when output shows up beside it.
FAQ
What does the USGS gallium price measure?
It is the average customs value of US imports of gallium metal under tariff code 8112.92.1000, which the February 2026 Mineral Commodity Summaries attributes to the Census Bureau. The 2025 cell is an estimate of $580 per kilogram, and the chapter calls it about 30% above the $439 printed for 2024. Wafer contracts and producer assessments outside that code are separate prices.
Which country produces primary low-purity gallium?
China, on the USGS count of primary low-purity material. The 2024 cell is 839,000 kilograms out of a rounded world total of 848,000, summarized in the chapter as 99%. Russia is estimated at 6,000 kilograms and Japan at 3,000, in 2024 and again in the 2025 estimate. The United States is a dash. China's 2025 estimate is 900,000 kilograms, beside a rounded world total of 900,000.
Why do US import origins differ from the producer list?
The import line records where metal entered the United States, and the production line records where primary low-purity gallium was first recovered. For 2021 through 2024, USGS lists sources as Canada 28%, Japan 22%, China 18%, Germany 16%, and other 16%. One New York company refines high-purity metal from imported low-purity feedstock and new scrap, so material first recovered in China can cross the US border under another origin.
Do Chinese gallium exports require a licence?
Yes, under Ministry of Commerce Announcement No. 23 of 2023, effective 1 August 2023, covering gallium metal plus gallium nitride, oxide, phosphide, arsenide, indium gallium arsenide, selenide, and antimonide. Exporters apply through provincial commerce authorities. Announcement No. 72, dated 9 November 2025, suspends paragraph 2 of the December 2024 US measure through 27 November 2026. The 2023 licence remains the text on those eight items.
Can a one-tonne US pilot replace imported gallium?
TRACE-Ga, announced in September 2025, sets a prototype goal of at least 1 metric ton a year, or 1,000 kilograms, beside estimated US consumption of 19,000 kilograms and world primary output of about 900,000. The 14-day campaign goal is at least 50 kilograms. USGS shows no US primary production through the 2025 estimate and records old scrap at none. A pilot changes the story when a later production cell replaces the dash.
This desk note is market analysis for readers who follow physical metal, and it is not a forecast, a price target, or an instruction to buy or sell gallium or any related contract. Capital put at risk can be lost.