

Visa's nominal payments volume reached $3,728 billion in the quarter ended 31 March 2026, and the service revenue that volume produced in the following quarter was $4,922 million, a line that $4,680 million of client incentives in the three months ended 30 June 2026 almost entirely offset. A network can look enormous on the volume page and ordinary on the service-revenue line once the incentive contracts are counted. Both prints come from Visa's own filings, and they sit badly together if payments volume is treated as a proxy for what the company keeps.
The same June quarter is harsher once Mastercard is beside it. Payment-network net revenue was $5,451 million, and that net included $5,997 million of rebates and incentives. The rebate was larger than the payment-network net. Headline net revenue of $11,633 million at Visa and $9,277 million at Mastercard therefore ranks two different objects: Visa prints four gross lines and then a contra-revenue incentive, while Mastercard's GAAP categories are already net of rebates and the gross assessments live in a management table kept apart from net revenue.
The calendars refuse a lazy match. Visa's fiscal year ends 30 September, so the three months ended 30 June 2026 are its fiscal third quarter, and the dollar payments-volume table in that Form 10-Q, filed 29 July 2026, stops at the prior quarter because service revenue is assessed on earlier volume. Mastercard's year is the calendar year, so June is its second quarter, and the dollar gross-dollar-volume table in the earnings release filed 30 July 2026 is the current quarter. A comparison built the way Caterpillar and Deere can be set on one equipment cycle has to name the quarter before it names a winner on size.
Updated 25 October 2026
What the annual reports call revenue
Visa's Form 10-K for the year ended 30 September 2025, filed 6 November 2025, describes the fee stack before the income statement adds it up. On Visa-branded transactions it provides authorization, clearing and settlement and may earn service, data processing, international transaction or other revenue. The statement of operations then shows those four lines, client incentives and net revenue.
Visa's critical-accounting section says the company enters long-term contracts with clients and other partners for cash and other incentives meant to grow payments volume and acceptance. "These incentives are primarily accounted for as reductions to net revenue; however, if a separate identifiable benefit at fair value can be established, they are accounted for as operating expenses." The June quarter's $4,680 million is that reduction, and an incentive with its own fair value would be an operating expense instead.
Mastercard's Form 10-K for the year ended 31 December 2025, filed 11 February 2026, opens on a different caption. "We classify our net revenues, which include the impact of rebates and incentives, from contracts with customers into two categories: (i) payment network and (ii) value-added services and solutions." Payment-network revenue is "primarily generated from charging fees to our customers based on GDV (which includes both domestic and cross-border volume) on the cards that carry our brands and for providing switching and other network-related services." Rebates are recorded within net revenue as that revenue is recognized, then trued up when customers report performance.
Visa's gross lines stay visible and the incentive is a line of its own. Mastercard's two GAAP categories have absorbed the rebates, so the gross sits in the assessments table. The Form 10-Q filed 30 July 2026 treats assessments as an internal operating view, separate from net revenue.
| Question the filing answers | Visa | Mastercard |
|---|---|---|
| What the latest 10-K calls revenue | Service, data processing, international transaction and other revenue, then client incentives as a reduction, then net revenue, for the year ended 30 September 2025 | Two net categories, payment network and value-added services and solutions, with rebates inside those nets, for the year ended 31 December 2025 |
| What the volume fee is tied to | Service revenue, assessed mainly on nominal payments volume from the prior quarter | Fees on gross dollar volume, domestic and cross-border together, plus switching and other network services |
| Where cross-border fees appear | International transaction revenue, a gross line of its own | Cross-border assessments, a management metric kept apart from net revenue |
| Where incentives sit | Primarily a reduction of net revenue, unless a separate benefit has a fair value and moves to operating expense | Inside net revenue, estimated over the contract and adjusted to reported performance |
| Where value-added work is printed | Inside data processing, other and service revenue; the June 2026 quarter is given as $3.8 billion | Its own net-revenue line, $3,826 million in the three months ended 30 June 2026 |
Volume, on the quarter each filing prints
Visa's June 10-Q defines payments volume as purchases on cards and other form factors carrying the Visa, Visa Electron, V PAY and Interlink brands, excluding Europe co-badged volume. Nominal payments volume is that amount in dollars. Cash volume is reported separately, and total nominal volume adds the two.
For the three months ended 31 March 2026, the quarter that drives June service revenue, nominal payments volume was $1,788 billion in the United States and $1,940 billion international, $3,728 billion in all. Cash volume of $626 billion took total nominal volume to $4,354 billion. Growth versus the prior March quarter was 11% nominal and 9% on a constant-dollar basis.
June 2026 is the activity quarter that lines up with Mastercard. The earnings release, Exhibit 99.1 to the Form 8-K filed 28 July 2026, gives growth and leaves the dollar level for the next service-revenue assessment: payments volume up 11% nominal and 10% constant-dollar, total cross-border volume up 15% nominal and 13% constant, and cross-border volume excluding intra-Europe up 14% nominal and 12% constant. The 10-Q counts processed transactions at 71,662 million, up from 65,443 million, and calls that count the main driver of data processing revenue. The lag works the way a line-by-line reading of Lam Research separates a recognized figure from the driver under it.
Mastercard gross dollar volume for the three months ended 30 June 2026 was $2,881 billion, up 9.2% in dollars and 8.0% in local currency. Purchase volume was $2,417 billion, up 9.6% in local currency, with cash volume of $464 billion and 57,096 million purchase transactions. The United States was $858 billion of that gross dollar volume. The release rounds the total to $2.9 trillion. A footnote includes some branded transactions processed off Mastercard's own switch, and switched transactions appear only as 9% growth.
| Volume print | Visa | Mastercard |
|---|---|---|
| Series | Nominal payments volume on Visa, Visa Electron, V PAY and Interlink, excluding Europe co-badged volume | Gross dollar volume, purchase volume plus cash, on the Mastercard-branded programs in the operating table |
| Period of the dollars | Three months ended 31 March 2026, feeding June service revenue | Three months ended 30 June 2026, beside that quarter's net revenue |
| Amount | Payments volume $3,728 billion; cash $626 billion; total nominal volume $4,354 billion | GDV $2,881 billion; purchase volume $2,417 billion; cash $464 billion |
| United States share | $1,788 billion of $3,728 billion, or 48% | $858 billion of $2,881 billion, or 30% |
| June 2026 transactions | 71,662 million processed transactions | 57,096 million purchase transactions; switched transactions grew 9%, and the count is off the 10-Q |
Incentives as a share of the gross
For the three months ended 30 June 2026 Visa's statement of operations shows service revenue of $4,922 million, data processing revenue of $6,042 million, international transaction revenue of $3,853 million and other revenue of $1,496 million. Those four lines sum to $16,313 million. Client incentives were $4,680 million and net revenue was $11,633 million, so the incentive comes off that gross and lands on net revenue with the arithmetic intact. Against a year earlier, service revenue rose 14%, data processing 17%, international transaction revenue 6%, other revenue 45%, incentives 18% and net revenue 14%.
Dividing $4,680 million by $16,313 million gives 28.7%. The same division on the nine months ended 30 June 2026 gives 28.1%, from incentives of $13,194 million and a four-line gross of $46,958 million, with net revenue of $33,764 million. Fiscal 2025 in the 10-K gives 28.3%, from incentives of $15,751 million and a four-line gross of $55,751 million, with net revenue of $40,000 million. The incentive share barely moves across those windows.
Mastercard's income statement starts at the net, so the June gross has to be rebuilt. Domestic assessments were $3,154 million, cross-border assessments $3,460 million, transaction processing assessments $4,508 million and other network assessments $326 million, summing to $11,448 million. The 10-Q says payment-network net revenue of $5,451 million included $5,997 million of rebates and incentives, up 22% as reported and 20% on a currency-neutral basis, "primarily due to an increase in our key drivers as well as new and renewed deals." Adding the rebate back to the net returns the $11,448 million of assessments, so the table and the sentence are one bridge.
Dividing $5,997 million by $11,448 million gives 52.4%. For the six months ended 30 June 2026 the bridge is $11,636 million of rebates against $22,035 million of assessments, or 52.8%, and payment-network net revenue of $10,399 million. The 2025 annual report records $20,522 million of those rebates inside that year's payment-network net revenue. The matched comparison stays the June quarter, because Visa's nine-month window is longer than Mastercard's six-month window and the denominators differ.
Value-added work pushes the denominators further apart. Visa's 10-Q puts that revenue at $3.8 billion in the June quarter and $10.3 billion in the nine months, inside data processing, other and service revenue, up 33% and 32%. Mastercard prints value-added services and solutions as its own net line, $3,826 million in the quarter, up 20%, and $7,276 million in the six months, equal to 41.2% of total net revenue of $9,277 million.
| Incentive bridge, quarter ended 30 June 2026 | Visa | Mastercard |
|---|---|---|
| Gross a reader can add | Four operating lines summing to $16,313 million | Four assessment lines summing to $11,448 million |
| Incentive | Client incentives $4,680 million, up 18% | Payment-network rebates and incentives $5,997 million, up 22% as reported |
| Share of that gross | 28.7% in the quarter, 28.1% for the nine months, 28.3% for fiscal 2025 | 52.4% of assessments in the quarter, 52.8% for the six months |
| What remains | Net revenue $11,633 million | Payment-network net $5,451 million; total net revenue $9,277 million after value-added services of $3,826 million |
Ryan McInerney, chief executive of Visa, described the quarter on the net the incentive had already reduced. In the 28 July release he said, "Visa delivered a strong fiscal third quarter, with net revenue up 14% year-over-year, GAAP EPS up 10% and non-GAAP EPS up 11%. Consumer and business spending remains resilient, and our strategy continues to deliver strong performance across consumer payments, commercial and money movement solutions and value-added services." That 14% is the growth left after $4,680 million came off $16,313 million. Michael Miebach, chief executive of Mastercard, used the same 14% in the 30 July release: "We delivered above expectations with net revenue growth at 14% year-over-year, or 12% on a currency-neutral basis in the second quarter." His payment-network net had $5,997 million of rebates inside it, so the shared 14% growth rate sits on two different splits between client and network.
The denominator decides the yield
Neither filing uses the phrase "take rate" for the ratios that follow. Each one divides a revenue line by the volume the same filing ties to that line, and each answers a different question. Stacking them into a single yield is how the comparison goes wrong.
Visa's service yield follows the 10-Q's own timing. Service revenue of $4,922 million in the three months ended 30 June 2026, divided by nominal payments volume of $3,728 billion in the three months ended 31 March 2026, is 13.2 basis points, or $1.32 of service revenue per $1,000 of that volume. The 10-Q credits the service-revenue increase to 11% nominal payments-volume growth, select pricing changes and card benefits, so the basis points mix price and mix, and they cover only the lagged volume fee.
A same-quarter Visa figure that uses the whole net has to run through transactions. Net revenue of $11,633 million divided by 71,662 million processed transactions is 16.2 cents per processed transaction. Data processing revenue of $6,042 million is 8.4 cents per processed transaction. That count prices some traffic on another basis from the service line.
RelatedCompare Lam Research (LRCX) Earnings, Line by Line
Mastercard's June GDV of $2,881 billion shares its quarter with net revenue. Total net revenue of $9,277 million is 32.2 basis points of that GDV, or $3.22 per $1,000. Payment-network net revenue of $5,451 million is 18.9 basis points. Gross assessments of $11,448 million are 39.7 basis points before the rebate, and the drop from 39.7 to 18.9 is the 52.4% rebate share seen from the volume side. On purchase volume of $2,417 billion, total net revenue is 38.4 basis points, because cash inside gross dollar volume dilutes the yield.
Currency moves the growth rates around those yields. Visa said exchange rates added about one percentage point to June and nine-month net-revenue growth. Mastercard's net revenue rose 14% as reported and 12% currency-neutral, and the drivers-of-change table assigns two percentage points of the payment-network increase to currency.
Cross-border weight in the fee stack
International transaction revenue of $3,853 million was 23.6% of Visa's $16,313 million four-line gross, behind data processing at 37.0% and service revenue at 30.2%, with other revenue at 9.2%. The 10-Q ties that international line to nominal cross-border volume excluding transactions within Europe, which grew 14%, with lower currency volatility and business mix working the other way. Total cross-border volume grew faster, at 15% nominal and 13% constant, and intra-Europe volume sits in that total while staying outside the series Visa says drives the fee.
United States net revenue was $4,410 million and international net revenue was $7,223 million, or 62% of June net revenue. March payments volume was closer to even, with international purchases at $1,940 billion of $3,728 billion, or 52%. Those two shares come from different quarters, so the richer international fee is a hint the lag has yet to confirm on one timetable.
At Mastercard, cross-border assessments of $3,460 million were 30.2% of the $11,448 million assessment gross, ahead of domestic assessments of $3,154 million, or 27.6%. Transaction processing was the largest line at $4,508 million, or 39.4%, and other network assessments were $326 million, or 2.8%. Cross-border volume grew 14% in dollars and 12% in local currency on all Mastercard-branded programs. The assessment share is the cross-border weight the filing actually supports.
The share-price series beside the filings
Share prices sit beside the filing comparison as a market print, and the chart is a history. On 23 October 2026 StockAnalysis recorded a regular-session close of $407.92 for Visa and $623.60 for Mastercard, both as of 4:00 pm Eastern. Visa finished $6.42 under the prior close of $414.34, down 1.55% on the day. Mastercard finished $9.61 under $633.21, down 1.52%. After-hours prints on the same feed were $408.10 for Visa and $622.99 for Mastercard at 7:59 pm Eastern.
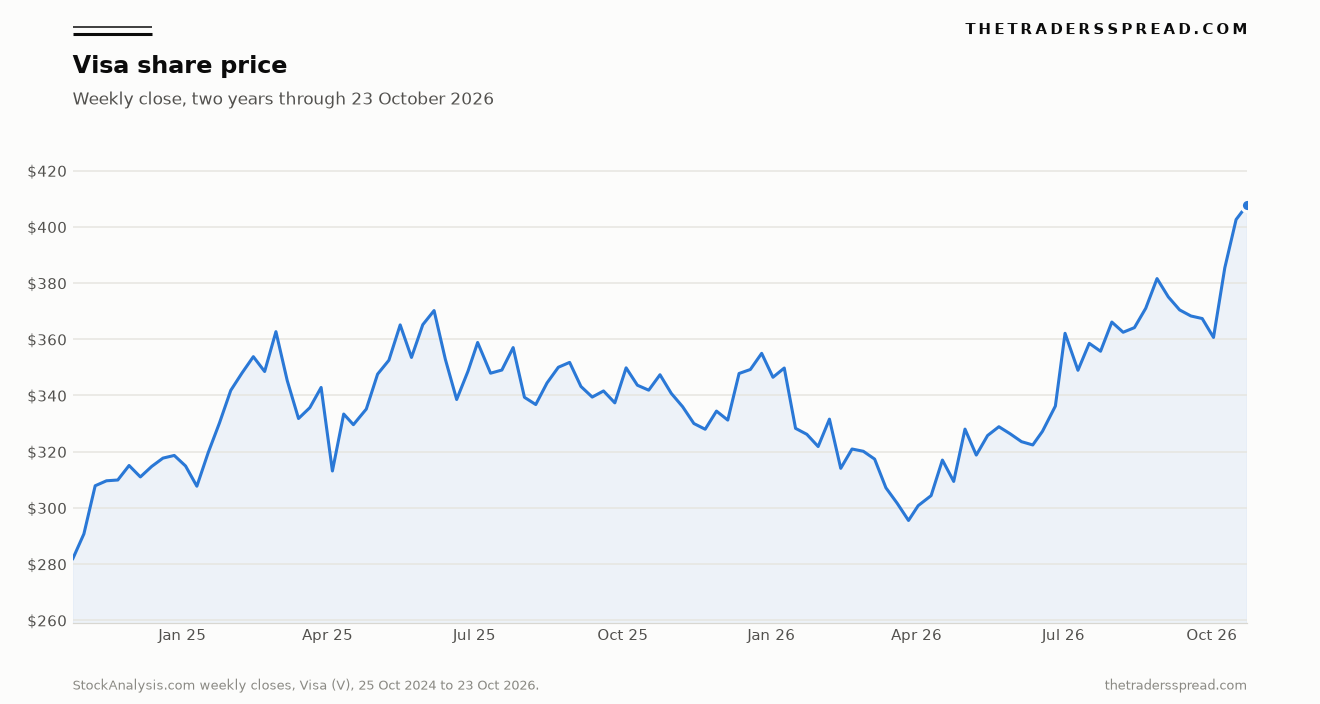
Weekly closes run from $281.73 on 25 October 2024 to $407.92 on 23 October 2026. The line prices a claim on Visa's net revenue after client incentives, and a factor list such as the five factors behind UnitedHealth is a reminder that one ratio rarely carries a share by itself.
What still separates the two networks
What survives a careful read is the construction. Visa shows a gross and one contra-revenue incentive near 28% to 29% of that gross in fiscal 2025, in the nine months to June 2026 and in the June quarter. Mastercard folds a rebate near 52% of assessments into payment-network net revenue. Visa's service fee lags volume by a quarter, so the latest dollar volume is March and the latest net revenue is June, while Mastercard's gross dollar volume and its net revenue share June, cash included. Cross-border assessments exceeded domestic assessments at Mastercard, and Visa's international transaction revenue still trailed data processing and service revenue. Value-added work is its own GAAP category only at Mastercard. Operating income is quieter: Visa's $6,877 million was 59.1% of net revenue, and Mastercard's reported operating margin was 60.2% on expenses of $3,690 million. The revenue build is where the filings still part company.
The ratios above are a reading of the Visa and Mastercard filings and earnings releases named in the text. A decision to buy or sell either share, and any price target, sits outside that reading.