

I opened Caterpillar's Form 10-Q for the quarter ended 30 June 2026 before I turned to Deere, and the backlog paragraph is what any comparison has to survive. Backlog Caterpillar believed to be firm was about $72.1 billion, roughly $9.4 billion higher than at the end of March, with the largest increase in Power & Energy. Deere's 10-Q for the quarter ended 2 August 2026, filed on 27 August, closes on a Sunday because Deere keeps a 52/53-week year. Caterpillar's quarter is a calendar one, filed on 5 August. The two latest prints overlap, and they still cover different months.
The pages also split inside each firm. Caterpillar's external sales were $8.261 billion in Construction Industries, $6.795 billion in Power & Energy and $4.568 billion in Resource Industries. All three primary segments rose, and construction's external increase of $2.138 billion was larger than the external increases at power and resource combined. Deere's production and precision agriculture sales fell 6 percent, to $3.998 billion, while construction and forestry rose 18 percent, to $3.618 billion, and small agriculture and turf rose 12 percent, to $3.383 billion. Calling both an equipment cycle flattens a construction-and-power quarter at one company and a small-equipment and earthmoving quarter, sitting on a large-agriculture decline, at the other.
Updated 24 October 2026.
Where did Caterpillar's sales dollar land?
On 23 October 2026 Caterpillar closed at $687.00, down $17.05, and Deere closed at $646.15, up $2.53, on the StockAnalysis Caterpillar page and the Deere page, both checked on 24 October 2026, with the close stamped 4:00 p.m. Eastern and attributed there to CBOE. The same pages put Caterpillar's market capitalisation at $315.80 billion on 459.67 million shares and Deere's at $174.22 billion on 269.63 million shares, figures they attribute to S&P Global Market Intelligence. Two prices about $41 apart describe quarters of $20.543 billion and $12.608 billion.
Caterpillar's consolidated sales and revenues for the three months ended 30 June 2026 were $20.543 billion, against $16.569 billion a year earlier, in the 10-Q filed on 5 August 2026. North America was $12.094 billion of the $20.543 billion, against $8.851 billion of $16.569 billion. That North American increase, $3.243 billion, is most of the $3.974 billion consolidated increase, with Latin America, Europe-Africa-Middle East and Asia-Pacific higher as well.
External sales, which leave inter-segment transfers out, are the cleaner ranking. Construction Industries external sales were $8.261 billion, up from $6.123 billion. Power & Energy external sales were $6.795 billion, up from $5.794 billion. Resource Industries external sales were $4.568 billion, up from $3.789 billion. Financial Products revenue was $1.145 billion, up from $1.042 billion. On total sales, construction was $8.346 billion, Power & Energy $8.238 billion and resource industries $4.648 billion. Power's total nearly ties construction only because inter-segment sales inside Power & Energy were $1.443 billion.
Joe Creed, chairman and chief executive officer of Caterpillar, said in the 4 August 2026 release that the quarter was the first time the company had generated over $20 billion of sales and revenues, and that strong order rates and a growing backlog reflected broadening momentum across all three primary segments. The same release puts higher sales volume at $3.1 billion and favourable price realisation at $595 million. Total-sales increases were $2.156 billion in construction, $1.201 billion in Power & Energy and $762 million in resource industries, so the breadth Creed described and a construction-led increment are the same quarter.
The segment name has already moved. The June 10-Q and the earnings release label the engine business Power & Energy. The retail-sales exhibit furnished with the 8-K says that, as the Rail division moved to Resource Industries, marine applications and on-highway engine support moved into Power & Energy's Industrial application. A comparison still using energy and transportation is reading a bucket that exhibit has taken apart. Power & Energy, on its glossary, is reciprocating engines, turbines, power generation, oil and gas, and industrial work. Resource Industries is mining, heavy construction, quarry and aggregates, and locomotives.
Inside Power & Energy the external dollars were uneven: power generation $3.098 billion against $2.407 billion, oil and gas $2.044 billion against $1.867 billion, industrial $1.653 billion against $1.520 billion. The earnings release says power-generation sales rose in large reciprocating engines and in turbines, primarily in data-centre applications, and the 10-Q outlook ties further growth there to data-centre build-out for cloud computing and generative artificial intelligence.
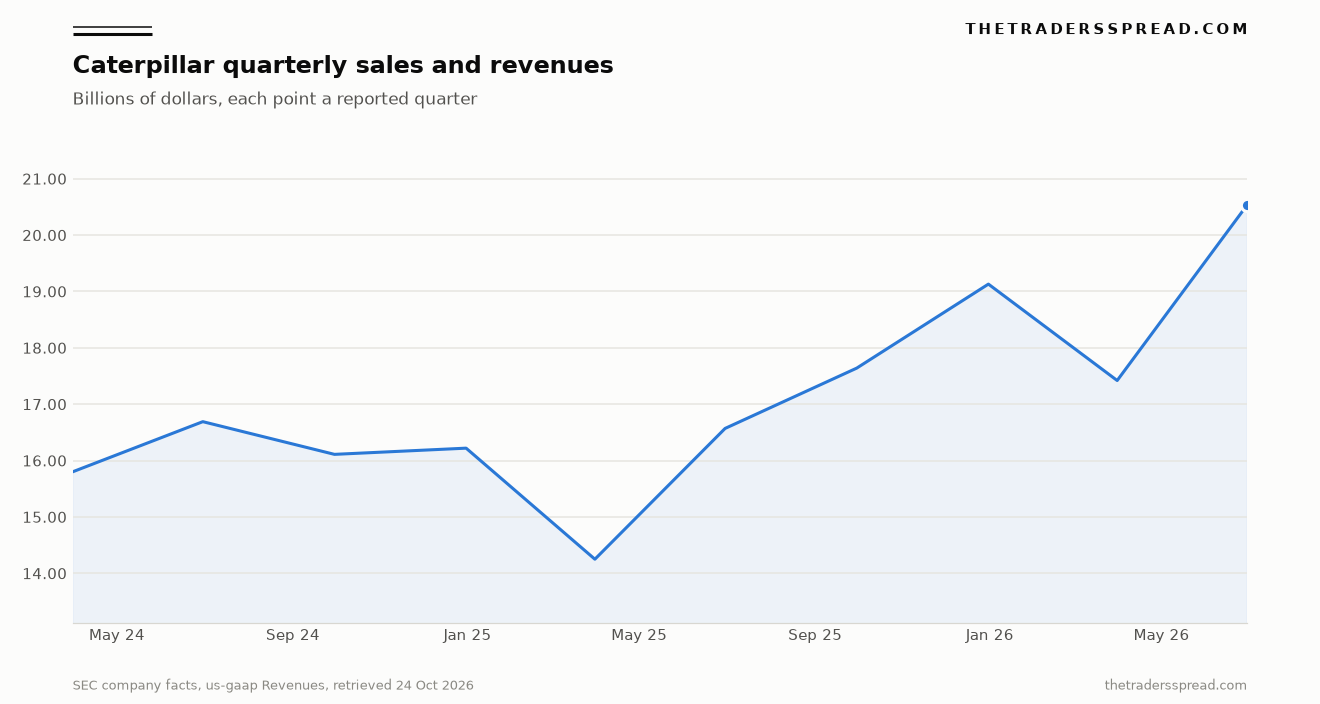
The line is that series, retrieved on 24 October 2026 and rounded to two decimals. June 2026 and June 2025 match the 10-Q at $20.543 billion and $16.569 billion. The same download puts March 2025 at $14.249 billion and March 2026 at $17.415 billion, so the June print follows a low, a dip into March 2026, and then the high of this window.
What was Deere selling while it called the year a bottom?
Deere's quarter ended on 2 August 2026, five weeks after Caterpillar's. Worldwide net sales and revenues were $12.608 billion, up 5 percent from $12.018 billion, and equipment-operations net sales were $10.999 billion against $10.357 billion, in the earnings release of 20 August 2026 and the 10-Q filed on 27 August. Net income was $1.379 billion, or $5.10 a share, against $1.289 billion, or $4.75. For nine months, net income attributable to Deere & Company was $3.808 billion, or $14.06, against $3.962 billion, or $14.57. The quarter's profit rose while the nine-month profit fell.
Production & Precision Agriculture, equipment for production-scale growers of large grains, small grains, cotton and sugarcane, reported net sales of $3.998 billion, down from $4.273 billion. Operating profit was $527 million against $580 million, a margin of 13.2 percent against 13.6 percent. The 10-Q attributes the decline to lower shipment volumes, primarily in Brazil and Europe, partly offset by price and by the Brazilian real and the Australian dollar. Over nine months, PPA sales were $11.664 billion against $12.571 billion, and operating profit was $1.372 billion against $2.066 billion.
Small Agriculture & Turf is easy to misfile as small tractors. The 10-Q defines it as equipment for dairy and livestock producers, high-value and small-acreage crops, and turf and utility customers. Net sales were $3.383 billion, up from $3.025 billion, and operating profit was $622 million against $485 million, a margin of 18.4 percent against 16.0 percent, the widest of the three equipment segments. A turf-and-livestock line out-earning large agriculture is a strange fact to fold into one ag cycle.
Construction & Forestry net sales were $3.618 billion, up from $3.059 billion, with operating profit of $436 million against $237 million and a margin of 12.1 percent against 7.7 percent. The segment covers earthmoving, forestry and roadbuilding. Equipment growth in the quarter was small agriculture and turf up about $358 million, construction and forestry up about $559 million, and production agriculture down about $275 million. The net equipment-sales increase of $642 million is what remains after that large-agriculture decline.
John C. May, chairman and chief executive officer, said on 20 August that Deere continued to believe 2026 would mark the bottom of the ag-equipment cycle, citing early-order programmes, improving used-equipment inventories, and technology adoption. The 20 August release puts numbers on the split the 10-Q describes in words: United States and Canada large agriculture down 15 to 20 percent and South American tractors and combines down 15 to 20 percent, against construction equipment up 5 to 10 percent, forestry down about 10 percent and roadbuilding up about 10 percent. Segment guides run production agriculture down about 10 percent, small agriculture and turf up about 15 percent, and construction and forestry up about 20 percent.
RealAgriculture carried the bottom-of-cycle line four days later, which is the version that travels when the segment table stays in the 10-Q.
Deere & Co. projects 2026 as the bottom of the current ag equipment cycle. CEO John May says early order trends and inventory adjustments provide confidence in a long-term recovery. #farming #agriculture
— RealAgriculture (@realagriculture) August 24, 2026
Read more: https://t.co/MqxI1gPHWp pic.twitter.com/wVjpGBdB3Q
That large-agriculture pressure shows up in the crop the farmer sells, which is why a corn price path sits next to a Deere quarter even though Deere sells the machine. The 10-Q names elevated input costs, commodity-price volatility and market uncertainty as the reasons United States and Canadian large-equipment demand is expected to fall.
How does dealer inventory show up on each page?
Caterpillar sells most machines and engines to independent dealers, and the gap between factory and end user becomes a dollar figure. Total dealer inventory rose $600 million in the second quarter of 2026, against a $100 million rise a year earlier. Construction Industries dealer inventory rose $400 million, against a $300 million decline a year earlier. Dealers are independent, the 10-Q says, and their stocks move with demand expectations, delivery times, seasonality and rentals. In North American construction, higher volume is tied both to end users and to the dealer-inventory change. Part of the construction increment stopped at the dealer.
The same 10-Q then schedules the reversal. It expects a slight dealer-inventory increase in the third quarter of 2026, modestly smaller than the prior-year third quarter, and a more typical decrease of over $1.0 billion in Construction Industries dealer inventory in the fourth quarter, with that stock still higher at year-end 2026 than at year-end 2025. It expects the swing to weigh on construction sales volume in the second half of 2026 relative to the second half of 2025. Factory sales and end-user demand can diverge while the stock adjusts, and the June number already includes one such quarter.
Exhibit 99.2 measures retail, which dealers volunteer on unaudited reports outside internal controls, as a trend indicator rather than a substitute for the audited statements. Power retail is reported in dollars, construction and mining retail in price-neutral unit dollars, and rail in direct-sale dollars. For the second quarter of 2026 the page shows total retail up 25 percent, power generation up 72 percent, industrial down 8 percent, construction worldwide up 22 percent, and resource industries up 17 percent, including rail up 272 percent after a 66 percent drop a year earlier. That rail print is a base effect on a different unit from the mining machines beside it.
Deere's 10-Q puts the channel in one sentence and the stock on the balance sheet. Equipment goes mainly through independent dealers, except roadbuilding in some markets outside the United States and Canada, which uses company-owned subsidiaries. Inventories Deere itself held were $7,811 million at 2 August 2026, $7,406 million at the 2 November 2025 year end, and $7,713 million at 27 July 2025. The 10-Q mentions dealers managing new and used stock inside a risk factor. Caterpillar's quarterly dollar bridge for dealer inventory has a Deere counterpart only as that company-held stock.
What does backlog name in each 10-Q?
Caterpillar's order backlog has an address in the 10-Q, under other matters: about $72.1 billion believed firm at 30 June 2026, about $9.4 billion above the first quarter, up in all three primary segments, largest increase in Power & Energy, with about $29.2 billion expected to stay unfilled beyond the next twelve months. Construction led the external-sales increase, and Power & Energy led the backlog increase. One figure describes the quarter that closed. The other describes work believed firm, and for $29.2 billion of it, work beyond the next year.
RelatedWhich Five Factors Move UnitedHealth (UNH) Shares?
A second Caterpillar figure is narrower. Unsatisfied performance obligations on contracts longer than a year were $44.1 billion, with about one-third expected as revenue in the next twelve months. Contracts of a year or less, primarily dealer sales of machinery, engines and parts, are left out. Ordinary dealer orders sit largely outside the $44.1 billion. The $72.1 billion is the wider management total. Setting the two side by side and calling the difference next year's revenue mixes a firm-backlog claim, a beyond-twelve-month slice, and a long-contract balance that excludes the dealer trade.
Deere's line is smaller because the scope is that long contract. Unsatisfied obligations longer than a year were $1,871 million at 2 August 2026, scheduled as $128 million in the rest of 2026, then $645 million, $455 million, $293 million, $183 million, $101 million and $66 million across 2027 through later years. Deere says contracts of a year or less, the dealer and retail sales of equipment, parts, repair and some telematics, are outside the disclosure. The order book a customer would recognise is, on that election, outside the $1.871 billion.
In the earnings release the phrase order book arrives as a bullet: order-book trends reinforce 2026 as the bottom of the ag-equipment cycle. Early-order programmes appear in May's comment in the same release, again without a dollar table on the pages that list remaining performance obligations. Caterpillar states a firm backlog in billions and a separate long-contract balance in billions. Deere states $1.871 billion of long contracts and a direction for an order book it leaves unquantified in that release. Quoting one backlog for both firms chooses Caterpillar's object and pastes Deere's name onto it.
Which end market actually moved the quarter?
The sales bridge is $3.1 billion of volume and $595 million of price inside the $3.974 billion increase, plus $199 million of currency on the machinery total. North American construction external sales were $5.065 billion of the $8.261 billion construction external total. The resource-industries outlook points end-user sales at copper and gold, which is why the copper tape belongs with that segment and the rail spike on the retail exhibit belongs in a footnote.
Data centres appear in both filings, in different segments. Caterpillar puts them in Power & Energy. Deere puts them in the construction outlook: United States and Canadian equipment demand supported by infrastructure, data centres, energy projects and rental fleets, with roadbuilding expected up and forestry expected down on weak residential building and lower log and lumber prices. A lumber path sits under that forestry line the way copper sits under Caterpillar's mines. One data-centre trade would have to hold an engine story, a building story and a large-agriculture decline together.
The tariff lines are a false pair and belong apart. Caterpillar expects 2026 tariff costs of around $2.2 billion after setting aside IEEPA recoveries recorded in the second quarter, and the earnings release says operating profit included $392 million of those recoveries. Deere's direct tariff impact was $502 million over nine months, net of recovery, against about $300 million a year earlier, with recoveries of $110 million in the quarter and $382 million over nine months.
Caterpillar Financial Products revenue was $1.145 billion, up 10 percent, with segment profit of $328 million against $248 million and Cat Financial past dues of 1.31 percent against 1.62 percent. Deere Financial Services revenue was $1.371 billion, down from $1.418 billion. Caterpillar's operating margin was 20.9 percent on profit of $4.295 billion, and Power & Energy's segment margin was 24.6 percent on profit of $2.027 billion, beside construction profit of $1.947 billion and resource profit of $693 million. Deere's equipment margins were 13.2, 18.4 and 12.1 percent. A generation margin of 24.6 percent and a large-tractor margin of 13.2 percent meet only at the level of a slogan.
What would a reader still need six months from now?
The open question is whether the next filings still mean the same objects, and whether the mix inside each firm flips. Caterpillar has already scheduled its dealer-inventory test: a slight further build in the third quarter, then a drop of over $1.0 billion in Construction Industries dealer inventory in the fourth, with year-end stock still expected above the end of 2025, and with that swing expected to lean against second-half construction volume. The backlog question is whether the Power & Energy increase converts, and whether the $29.2 billion placed beyond twelve months is still out there.
For Deere, the open point is whether production-agriculture shipments stop falling after a year called the bottom, or whether turf and construction keep carrying sales while large agriculture stays subdued. The $1.871 billion of long contracts matters only beside whatever the next 10-Q says in dollars about the order book. StockAnalysis, checked on 24 October 2026, listed Caterpillar's next earnings date as 29 October 2026 and Deere's as 25 November 2026. By late April 2027 the comparison still needs the intervening 10-Qs, Caterpillar's dealer bridge if it is still published, and Deere's own words on whether 2026 stayed the bottom after another fiscal year-end.
The figures above come from the filings and quote pages named in the text, each dated to its document. The reading sets no price target on either share.