

Lam Research filed its quarterly report on Form 10-Q for the quarter ended 27 September 2026 with the Securities and Exchange Commission on 22 October 2026, and that filing is the page we open before the headline numbers. The day before, the company furnished the earnings release as Exhibit 99.1 to a Form 8-K. Most readers meet the release first. The 10-Q is the slower pass: the geographic table, the deferred-revenue note, and the repurchase footnote.
A record quarter and a hard session can share a page. Revenue was $8.22 billion, GAAP diluted earnings were $2.19 a share, and non-GAAP gross margin was 52.4 percent, all in that Exhibit 99.1. The Nasdaq close on 22 October 2026 was $230.15, down 11.76 percent from $260.81. We score five lines against each other: China revenue share, gross margin, deferred revenue, the wafer-fab equipment outlook, and the buyback or the share count. China share jumped while the finance chief was already framing a fade, margin rose on mix, and deferred revenue rose with it. The spending outlook widened while supply held the next revenue guide, and an open repurchase leaves the September share count in the math. A search for how to read Lam Research earnings still lands on these five lines months from now.
Updated 23 October 2026
Key facts for the September 2026 quarter, each with its source.
- Revenue was $8.22 billion, against $6.72 billion in the June 2026 quarter and $5.32 billion in the September 2025 quarter. Source: Lam Research Form 10-Q, filed 22 October 2026.
- China accounted for 35 percent of revenue, against 26 percent in June 2026 and 43 percent in the September 2025 quarter. Source: Lam Research Form 10-Q geographic table, filed 22 October 2026.
- GAAP gross margin was 52.3 percent of revenue, against 51.7 percent in June 2026 and 50.4 percent a year earlier. Source: Lam Research Form 10-Q, filed 22 October 2026.
- Deferred revenue was $2.66 billion at 27 September 2026, against $2.43 billion at 28 June 2026. Source: Lam Research Form 10-Q management discussion, filed 22 October 2026.
- December-quarter guidance was revenue of $8.60 billion plus or minus $400 million, and a diluted share count of 1.253 billion. Source: Exhibit 99.1 to the Form 8-K, furnished 21 October 2026.
- The Nasdaq regular-session close on 22 October 2026 was $230.15, 11.76 percent under the prior close of $260.81. Source: StockAnalysis.com LRCX quote, 4:00 p.m. Eastern time, 22 October 2026.
Five lines, and the order we read them
One sitting is enough when the order is fixed. The release of 21 October 2026 leads with revenue, margin, and earnings per share, then geography, the systems split, and a one-quarter outlook. The Form 10-Q filed on 22 October 2026 adds the deferred-revenue ageing and the accelerated share repurchase. The call that afternoon is where the wafer-fab dollar figure lives.
Tim Archer is president and chief executive officer, the title on the company overview opened on 23 October 2026 and the title in the release. Douglas R. Bettinger, executive vice president and chief financial officer, signed the 8-K. Geography comes first and the share count comes last. Margin, deferred revenue, and the wafer-fab outlook sit between them, because China timing, mix, the contract balance, and an open repurchase are the parts that move.
"With AI driving higher semiconductor demand and greater device complexity, our focus on operational execution helped Lam deliver record revenue, profit, and earnings per share in the September quarter," Archer said in the release. He added that strategic investments were strengthening the ability to outgrow wafer fabrication equipment as the industry expands. The five lines are what turn that claim into a model.
China share beside gross margin
For the quarter ended 27 September 2026 the 10-Q puts China at 35 percent of revenue, Korea at 20, Taiwan at 18, Japan at 9, the United States at 8, Southeast Asia at 6, and Europe at 4. A quarter earlier China was 26 percent and Taiwan was 27 percent. A year earlier China was 43 percent and Korea was 15 percent. China revenue was $2.886 billion, against $2.283 billion a year earlier, so the share fell over the year while the dollars rose. Sequentially the share jumped nine points.
Foundry was 46 percent of equipment and upgrade revenue, memory 46 percent, and logic 8 percent, against 44, 46, and 10 percent in June and 60, 34, and 6 percent a year earlier. The 10-Q says the foundry percentage rose versus June mainly on mature-node timing in China, while memory's dollar growth versus the prior year outpaced foundry.
On the 21 October call, Bettinger said China was 35 percent of revenue, up from 26 percent, on domestic and multinational investment, and that he expects a significantly lower China percentage in December. Annualizing 35 percent locks in a quarter the company has already called heavy, and 43 percent is a poor stand-in for a book that has grown faster outside China.
| Line | Quarter ended 27 Sep 2026 | Quarter ended 28 Jun 2026 | Quarter ended 28 Sep 2025 |
|---|---|---|---|
| China share of revenue | 35 percent ($2.886 billion) | 26 percent | 43 percent ($2.283 billion) |
| GAAP gross margin | 52.3 percent ($4.299 billion) | 51.7 percent ($3.479 billion) | 50.4 percent ($2.685 billion) |
| Deferred revenue | $2.66 billion | $2.43 billion | Compared with June in the release |
| Wafer-fab equipment outlook | Calendar 2026 mid-$150 billion; preliminary 2027 above $200 billion | A forward view from the 21 October call | Forward figure, prior column left blank |
| Common shares outstanding | 1.249 billion | 1.251 billion | 1.259 billion |
GAAP gross margin was $4.299 billion, or 52.3 percent, against 51.7 percent in June and 50.4 percent a year earlier. The sequential rise is tied mainly to mix, and the year-on-year rise to mix plus volume. Non-GAAP gross margin was 52.4 percent, or $4.305 billion, against 52.0 percent in June. The bridge is about $2.7 million of acquired-intangible amortization and about $3.5 million of elective deferred-compensation valuation in cost of goods sold, a plan mark sitting beside a contract balance.
December guidance puts gross margin, GAAP and non-GAAP, at 52.5 percent plus or minus one point, a band of 51.5 to 53.5 percent. Bettinger said he expects 52.5 percent, improving a little in spite of customer-mix headwinds. The headwind is the China fade already on the call, and the guide still allows margin to tick up through it. Inside the band the September margin holds, and outside it the geographic table has to be rebuilt into the model.
Systems revenue was $5.733 billion, against $4.250 billion in June and $3.548 billion a year earlier. Customer support, including services, spares, upgrades, and Reliant tools, was $2.487 billion, $2.472 billion, and $1.777 billion. Systems rose $1.48 billion, or 35 percent, versus June. Support rose by $709.9 million, or 40 percent, versus the prior year, so the sequential acceleration lived in new equipment.
Deferred revenue, with Japan shipments beside it
Deferred revenue was $2.661 billion on 27 September 2026, rounded to $2.66 billion in the discussion, against $2.43 billion on 28 June. Within a year sits $2.027 billion, one to three years $540 million, and after three years $94 million. The longer buckets stay in deferred profit because the customer can demand performance at any time. Higher sales volume drove the increase, partly offset by lower customer down payments.
Revenue of $901.2 million that sat in deferred profit at 28 June, 37 percent of the $2.43 billion opening balance, was recognized in the quarter, and the ending balance was still higher, so new deferrals outran a large draw. A later drop that arrives with revenue inside the guide reads as a delivery schedule. A later drop that arrives with revenue under the $8.20 billion low end reads as a change of job, with down payments as the piece to inspect.
Japan shipments sit outside that balance because control passes at customer acceptance, and the tools stay in inventory at cost. Estimated future revenue was about $468.3 million at 27 September, against $490.2 million at 28 June. Inventory overall was $4.551 billion, against $4.276 billion in June. Cash, equivalents, and restricted cash ended at $7.45 billion after $3.50 billion of operating cash flow, $257.7 million of capital spending, and $325.4 million of dividends. Free cash flow on his definition, operating cash minus capital spending and intangibles, was a record $3.24 billion.
Wafer-fab equipment, then the December guide
The filing warns that wafer-fab assumptions may prove invalid and leaves the dollar size of the market to the call. "For calendar year 2026, we expect WFE in the mid $150 billion range. Our preliminary 2027 WFE outlook is for more than $200 billion of spending, with percentage growth led by DRAM, followed by leading-edge foundry logic and NAND," Archer said. Including the December midpoint, he expects calendar 2026 systems revenue to grow well over 40 percent, and he says served market has expanded four points of wafer-fab equipment over a few years.
Clean-room space and component constraints, he said, are likely to limit how fully the industry meets demand as 2027 begins. Bettinger said the December revenue guide would have been a bit higher absent near-term supply constraints. Revenue is set at $8.60 billion plus or minus $400 million, so the band is $8.20 billion to $9.00 billion, and the midpoint is 4.6 percent above September's $8.22 billion. Operating margin is guided at 40.5 percent plus or minus a point, against September GAAP of 40.0 percent and non-GAAP of 40.2 percent. Diluted earnings are guided at $2.33 plus or minus $0.15, a constrained quarter sitting under a two-year industry speech.
Cumulative Aether dry-resist revenue is now put around $2.5 billion by the end of the decade, about $1 billion above the prior figure. A shift toward single-level-cell NAND, Archer said, cuts bits per device by roughly three times versus triple-level cell and needs about 2 percent more installed wafer capacity per point of mix. Income tax expense was $559.1 million on pretax income of $3.312 billion. The non-GAAP tax rate was 16.5 percent, against 11 percent, and Bettinger said to keep that range for December. The bridge includes $11.5 million of tax from a change in law, and GAAP diluted earnings were still $2.19, against $1.81 and $1.24.
The buyback against the share count
Diluted weighted-average shares were 1,255,768 thousand in September, about 1.256 billion, against a December guide of 1.253 billion. Common shares outstanding were 1,249,145 thousand at 27 September 2026, 1,251,278 thousand at 28 June, and 1,259,176 thousand a year earlier. Ending shares and the diluted average count different things. The basic average, 1,250,883 thousand, sits between the start of the quarter and the end.
Lam signed accelerated share repurchase agreements with two institutions for $1.00 billion and took initial delivery of about 2.3 million shares, 75 percent of the prepayment divided by the close on the execution day. Final shares depend on the volume-weighted price over the window, less a discount, with settlement expected in the quarter ending 27 December 2026. The program table shows 2.344 million shares at a cost of $1.011 billion, leaving $3.032 billion of the May 2024 authorization. The $329.17 average in that table excludes the accelerated contract. Cash-flow treasury stock purchases were $1.025 billion, including employee-equity settlement and excise tax. Dividends declared rose to $0.33 from $0.26. Bettinger put capital return near 41 percent of free cash flow, against a long-term plan of 85 percent, with the 1.253 billion guide count still waiting on settlement.
How the five lines score against each other
China share is the swing factor, nine points higher, with a lower December share already described. Gross margin is the line that held, a tenth of a point between GAAP and non-GAAP, with a guide that still points slightly up through a mix headwind. Deferred revenue supported the quarter on volume and softened on down payments, and Japan stays in its own bucket. The wafer-fab outlook is the long line, and the buyback stays quiet until settlement. The same spending speech reads differently if China fades than if China stays near 35 percent.
RelatedBlackstone (BX) Falls 6.7% in the Five Sessions to 19 Oct
| Line | What September 2026 did | Rank against the other four | What would change the reading next |
|---|---|---|---|
| China revenue share | 35 percent, up from 26 percent, with a lower December share on the call | Swing factor | A December share near 35 percent, or a drop that pushes margin outside the band |
| Gross margin | GAAP 52.3 percent, non-GAAP 52.4 percent, guide 52.5 percent plus or minus one point | The line that held | A result outside 51.5 to 53.5 percent |
| Deferred revenue | $2.66 billion, up about $227 million, after $901.2 million of the old balance was recognized | Support, split by down payments | A smaller balance with revenue under the $8.20 billion low end |
| Wafer-fab equipment outlook | Mid-$150 billion for 2026 and a preliminary 2027 figure above $200 billion | The long line | A walk-back of the 2027 figure, or a supply comment that cuts the guide |
| Buyback and share count | $1.00 billion accelerated repurchase, diluted average about 1.256 billion, guide 1.253 billion | Quiet until settlement | Settlement past December, or a diluted count still near 1.256 billion |
One session after the 21 October release
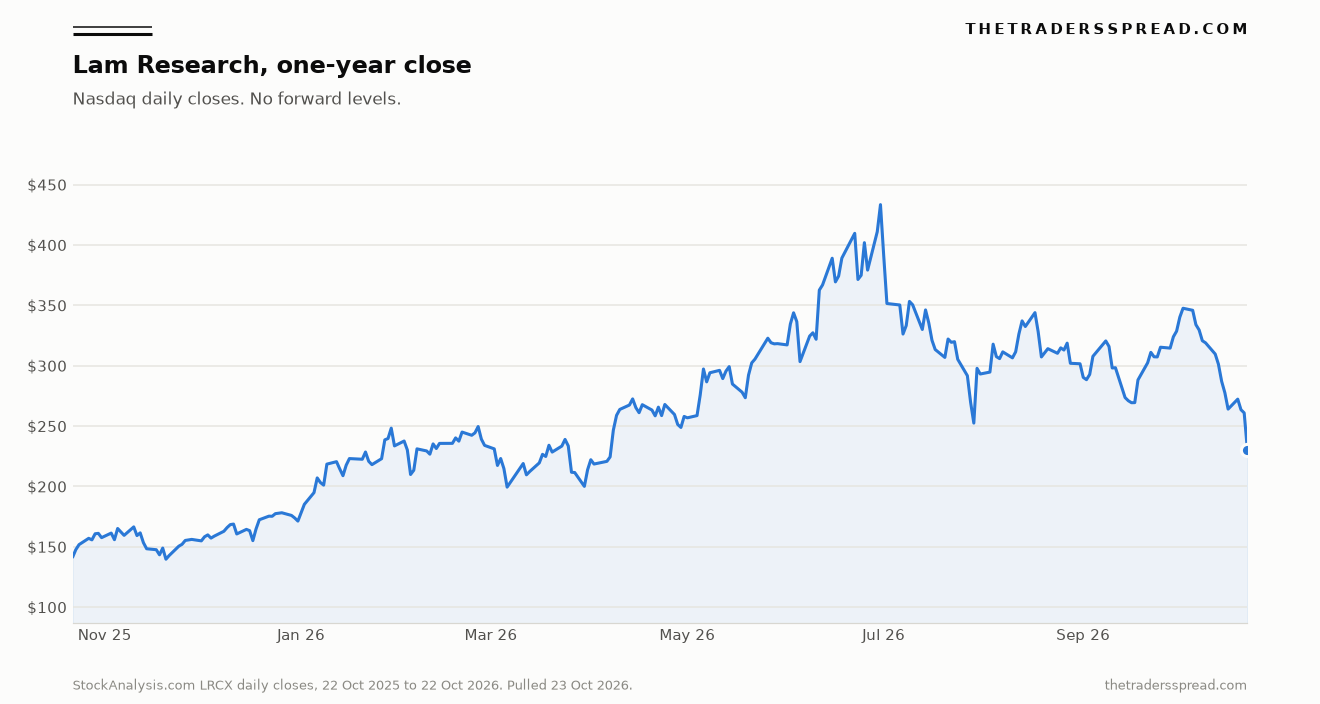
The close is a dated worked example in the body. Ram Ganesh, vice president of investor relations, said the release went out a little after 1:00 p.m. Pacific on 21 October, and that session closed at $260.81, down 1 percent. The session that had the release and the call in hand was 22 October. StockAnalysis.com, timestamped 4:00 p.m. Eastern time, shows a Nasdaq close of $230.15, down 11.76 percent, on volume of 22,998,287 shares. After hours the same feed showed $228.76 at 7:59 p.m., a further 0.6 percent, which we leave beside the regular close.
The chart is the one-year daily series from that feed, running from 22 October 2025 through 22 October 2026, with forward levels left off. The first close in the series is $141.25, the highest close is $433.33 on 30 June 2026, and the last close is $230.15.
What a lam research stock forecast leaves out
A forecast that starts from a target price usually keeps the earnings guide and drops the other four lines. The guide is $2.33 plus or minus $0.15 on 1.253 billion diluted shares, inside a revenue band of $8.20 billion to $9.00 billion, and that band covers one quarter. Choosing a multiple for a stream of such quarters is where this page stops, and that multiple is where China share, margin, deferred revenue, the 2027 wafer-fab figure, and the diluted count come back in.
Applied Materials, ASML, and TSMC can each have a week unlike Lam's 22 October session. Lithography, a broad tool book, and a foundry capital budget are relatives of etch, and each business files on its own. We still score Lam on Lam's five lines.
Questions that keep coming back
Where does a one-sitting read of a Lam Research release start?
The geographic percentage table comes first, then the systems and customer-support split, then gross margin on both the GAAP and non-GAAP lines. The 10-Q supplies the deferred-revenue ageing and the repurchase footnote. The call supplies the wafer-fab dollar figure and any comment on next-quarter China share. The outlook box is last, read as a range with a share count, once those five lines sit together.
Why can gross margin and the China share rise together?
The September 2026 print is the worked example. The 10-Q ties the margin increase to mix and the foundry-mix increase to mature-node timing in China. The call then points to a lower China share in December and still guides gross margin a little higher, calling mix a headwind. The pairing can last a quarter and gets re-scored when the next table shows whether China faded and whether margin stayed inside 51.5 to 53.5 percent.
Which share count belongs in the earnings figure?
The diluted weighted average, about 1.256 billion shares for September 2026, is the count for the quarter being reported. The 1.253 billion figure is the denominator under the December guide. Ending shares, 1.249 billion at 27 September, are a balance-sheet count, and treasury cash is a third figure. Because the accelerated repurchase is expected to settle in the December quarter, the guide's count is partly a statement about that settlement.
The line that would change the reading
The reading we carry out of this print is a joint one. China share fades from 35 percent and margin stays inside the band. Deferred revenue keeps a volume explanation, with Japan watched on its own. The diluted count moves toward 1.253 billion as the repurchase settles, with the wafer-fab speech left on its mid-$150 billion 2026 and preliminary 2027 figure. One line defecting, while the others stay put, is what changes the reading.
Which line in the next print would change that reading: a China share that stays elevated, a gross margin outside the band, a deferred-revenue balance that shrinks while revenue lands under the low end of the guide, a wafer-fab outlook that walks back the preliminary 2027 figure, or a diluted share count still at the September level when the accelerated repurchase was supposed to have settled?
The figures above are reference data from the Form 10-Q filed on 22 October 2026, Exhibit 99.1 furnished on 21 October 2026, the earnings call that afternoon, and the StockAnalysis.com close timestamped 22 October 2026. Nothing here is a recommendation to buy or sell shares of Lam Research, and nothing here is a price target.