

I split Exxon's June-quarter segment note before treating the $184.54 close as a read on the barrel, because Upstream and Energy Products posted derivative timing effects with opposite signs in the same three months.
| Item | Figure | Source and date |
|---|---|---|
| Regular-session close | $184.54 | StockAnalysis quote, 26 Oct 2026, 4:00 PM EDT |
| Session high and 52-week high | $184.59 | StockAnalysis quote, same stamp |
| 52-week low on the quote | $112.51 | StockAnalysis quote, same stamp |
| Close on 30 June 2026 | $136.72 | StockAnalysis daily history, one-year file |
| Close on 28 Oct 2025 | $115.03 | StockAnalysis daily history, one-year file |
| Lowest close in that file | $113.68 on 5 Nov 2025 | StockAnalysis daily history |
| Q2 2026 net income attributable to ExxonMobil | $14,525 million | Form 10-Q filed 3 Aug 2026 |
| Q2 2026 segment income | Upstream $7,927 million (United States 1,920, outside the United States 6,007); Energy Products $5,465 million (2,987 and 2,478); Chemical Products $1,131 million (599 and 532); Specialty Products $956 million (287 and 669) | 10-Q Note 3, quarter ended 30 June 2026 |
| Q2 2025 segment income | Upstream $5,402 million (1,212 and 4,190); Energy Products $1,366 million (825 and 541); Chemical Products $293 million (255 and 38); Specialty Products $780 million (291 and 489) | Same note, prior-year column |
| Q2 oil-equivalent production | 4,514 thousand barrels a day, versus 4,630 | 10-Q upstream operational results |
| Q2 refinery throughput | 3,562 thousand barrels a day, versus 3,936 | 10-Q energy products operational results |
| Q2 earnings per share | $3.48, versus $1.64 | 10-Q income statement |
| Q2 average WTI | $95.65, versus $64.57 a year earlier | FRED DCOILWTICO, retrieved 27 Oct 2026 |
The session close is the reference print. The StockAnalysis quote stamped it at 4:00 PM EDT on 26 October 2026, and the same feed showed an after-hours price of $184.42 at 7:59 PM EDT. The day finished a few cents under the 52-week high. An Exxon stock forecast that stops at the crude print misses the split inside the quarter. The upstream earnings bridge in the Form 10-Q filed on 3 August 2026 assigns a $180 million earnings reduction to unfavorable derivative marks. The Energy Products bridge assigns a $2,560 million earnings increase to favorable derivative marks. Upstream was still the larger book in dollars. Add the four segment results and the total is $15,479 million. A $954 million corporate and financing loss brings that figure to the $14,525 million of net income attributable to ExxonMobil.
A year earlier those four books earned $5,402 million, $1,366 million, $293 million and $780 million. Upstream rose 46.7 percent, Energy Products rose to four times its year-ago result, Chemical Products rose 286 percent, and Specialty Products rose 22.6 percent. Upstream's share of segment income fell from 68.9 percent to 51.2 percent while the upstream dollar result rose. The larger year-on-year earnings increase sat in Energy Products, not in Upstream.
Two timing marks, one quarter
The upstream price line is still tied to crude. The bridge attributes $4,650 million of the upstream increase to higher crude realizations, with lower gas realizations offsetting part of that same line. Guyana and Permian growth contributed $1,140 million. Middle East disruption removed $1,060 million from upstream earnings and $310 million from Energy Products. Higher depreciation pulled the upstream expense bridge down by $690 million. Identified items were a $1,199 million loss tied to financial reserves. The net upstream increase, from $5,402 million to $7,927 million, is what remains after those offsets.
Energy Products ran a different sum. Stronger refining margins contributed $3,180 million of the year-on-year increase, and derivative timing contributed $2,560 million. Identified items, mainly impairments, were a $1,180 million loss in that bridge. The reported $5,465 million is the GAAP segment result. The bridge walks from the year-ago quarter, so the pieces are effects on the change. For the six months, the same book shows a timing effect that decreased earnings by $770 million, which the company ties mainly to rising crude prices. The quarter and the half-year disagree on the sign of the mark.
Six-month Energy Products income was $4,203 million, from $3,648 million in the United States and $555 million outside it. Subtract the second-quarter $5,465 million and the remaining quarter is a $1,262 million loss. Six-month upstream income was $13,664 million, from $3,494 million in the United States and $10,170 million outside it, so the same subtraction puts the remaining quarter at $5,737 million of upstream income. Net income attributable to ExxonMobil for the half was $18,708 million, which leaves $4,183 million in the remaining quarter. One segment book was in loss across that derived quarter while upstream earned about $5.7 billion. The paths diverged inside a single half-year.
Volumes moved against the profit jump
Oil-equivalent production in the second quarter was 4,514 thousand barrels a day, down 116 thousand from 4,630 a year earlier. The filing describes the drop as Middle East disruption, mostly offset by Permian and Guyana growth. Liquids production rose, from 3,259 thousand barrels a day to 3,373. Natural gas available for sale fell from 8,219 million cubic feet a day to 6,849, and the Asia line fell from 3,206 to 1,274. United States liquids were 1,653 thousand barrels a day against 1,494. Canada and Other Americas liquids were 922 against 797. The regional table carries those place names. The growth sentence names the Permian and Guyana on their own.
Refinery throughput fell from 3,936 thousand barrels a day to 3,562, a 9.5 percent decline, while Energy Products sales rose from 5,588 thousand barrels a day to 5,698. Sales and other operating revenue rose from $79,477 million to $114,529 million, or 44.1 percent. The second-quarter average for WTI was $95.65, up 48.1 percent from $64.57. Brent's second-quarter average was $102.63, up 50.8 percent from $68.07. Upstream earnings rose 46.7 percent, close to those crude averages. Downstream profit rose much faster, on lower runs.
Chemical Products earnings moved on a feedstock spread. The driver page credits $980 million of the increase to a wider North America ethane feed advantage and to performance-chemical margins. Advantaged volume growth decreased earnings by $130 million, on weak Asia Pacific market dynamics. Ethane against naphtha is a gas-liquids relationship sitting beside the crude realization, so the chemical book and the upstream price line are separate mechanisms even in a quarter when both are firm.
The share since 30 June
The one-year history file runs from a close of $115.03 on 28 October 2025 to $184.54 on 26 October 2026, a rise of 60.4 percent. The low close in that file is $113.68 on 5 November 2025, distinct from the $112.51 figure on the quote, which can be an intraday low. On 30 June 2026 the close was $136.72. From there to the latest close the share rose 35.0 percent. The FRED WTI series, retrieved on 27 October 2026, shows $60.97 on 28 October 2025 and $107.89 on 20 October 2026, a rise of 77.0 percent. The Brent series shows $64.03 and $115.22 on those dates, a rise of 79.9 percent. From 30 June to 20 October, WTI rose from $70.56 to $107.89, or 52.9 percent, and Brent rose from $70.46 to $115.22, or 63.5 percent.
Over both windows the barrel's percentage move was larger than the share's. The tape has carried a crude relationship since the quarter ended. The filing says the bigger earnings increment was in Energy Products, and $2,560 million of that increment was a derivative timing effect. The high daily Brent observation in the second-quarter FRED sample was $138.21, and the 30 June observation was $70.46, so the quarter that produced the favorable downstream mark also contained a sharp slide from the average. The Brent scenario and the WTI report on this site follow the barrel. The share also carries refining margins, a chemical feedstock spread, and a mark-to-market book. Refinery activity is its own series as well. The gasoline note tracks American pump prices and Midwest runs, while Exxon's worldwide throughput in the June quarter was the 3,562 thousand barrels a day in the table above.
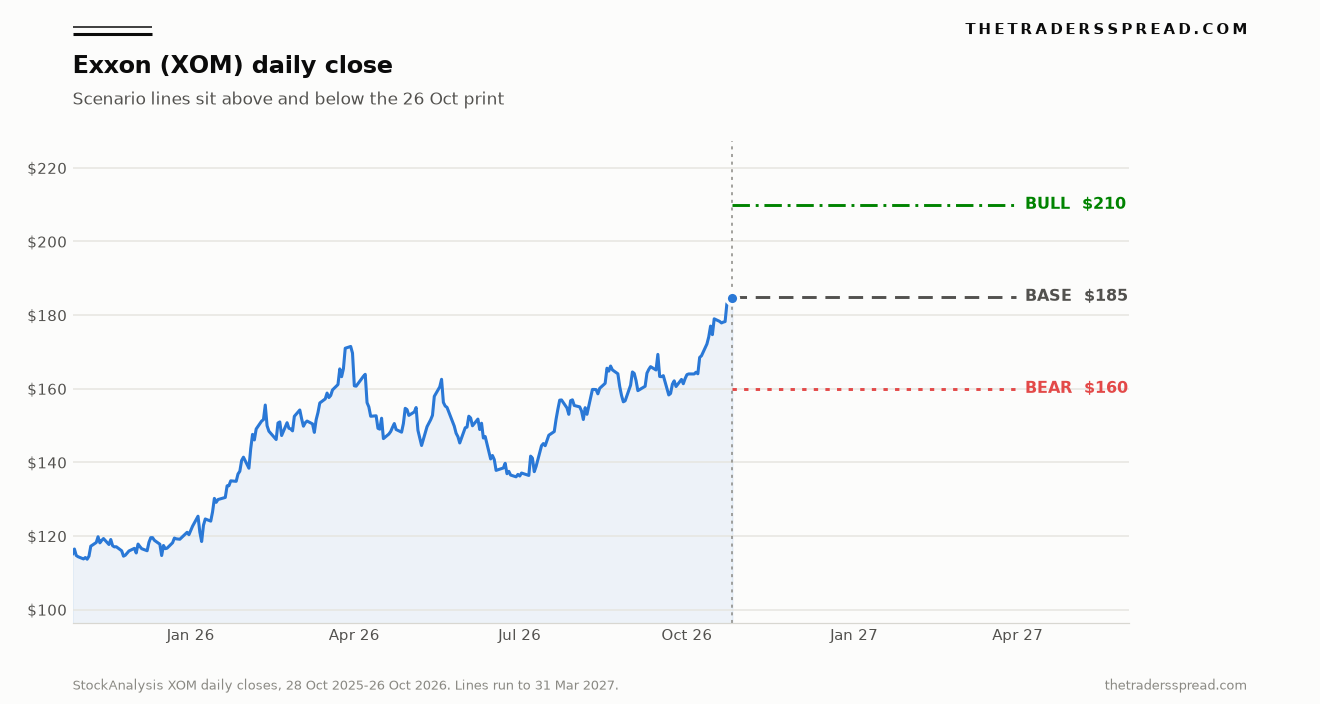
The chart uses every daily close in that one-year file. The bull line at $210 is above the latest print. The bear line at $160 is below it. The base line at $185 sits almost on the close. The lines start at the last close and run forward to 31 March 2027. They frame the next leg and leave the plotted history as the record of how the shares got here.
How $210, $185 and $160 are built
| Case | Level | Gap versus $184.54 | Earnings pace | Multiple |
|---|---|---|---|---|
| Bull | $210 | 13.8 percent above | $3.48 across four quarters, or $13.92 | 15.1 times |
| Base | $185 | 0.2 percent above | $4.47 across two halves, or $8.94 | 20.7 times |
| Bear | $160 | 13.3 percent below | $8.94, the same first-half pace | 17.9 times |
$210 is 15.1 times second-quarter earnings of $3.48 a share taken across four quarters. It stands 13.8 percent above $184.54. The multiple is lower than the 20.6 times the close places on a doubled first-half pace of $8.94. At $184.54 the shares already embed that 20.6 times figure, because $184.54 divided by $8.94 lands there. The bull case asks the second-quarter rate to persist and accepts a lower multiple on that higher pace. It is the optimistic earnings case, and it is a milder valuation case.
The $185 line is the base, at 20.7 times the same $8.94 pace and 0.2 percent above the print. It describes a market that keeps paying roughly the current multiple for a blend of the derived weak quarter and the strong quarter. $160 is 17.9 times $8.94 and 13.3 percent under the print. It describes a slip from 20.6 times toward 18 times if buyers treat the first-half blend as the earnings power. The 30 April close was $154.33 and the 31 July close was $155.44, so $160 also sits near the shelf the shares left behind on the way to the October high.
The 30 June share count was 4,112 million shares. Applied to the 26 October close, that count implies an equity value of about $758.8 billion. The count is the latest one in the 10-Q, and it predates the price by nearly four months. The company repurchased 33 million shares in the June quarter and 67 million in the half. Outstanding shares were 4,263 million on 30 June 2025. Net income rose from $7,082 million to $14,525 million, about 2.05 times, while earnings per share rose from $1.64 to $3.48, about 2.12 times. The smaller share count explains the gap between those two ratios. The June-quarter dividend was $1.03 a share, against $0.99 a year earlier, and the six-month dividend was $2.06. Four times the latest quarterly dividend is $4.12, or 2.2 percent of the 26 October close. That is the paid rate in the filing.
What would make either reading wrong
The bull line at $210 becomes the wrong reading if a later quarterly report shows Energy Products back near the derived first-quarter loss of $1,262 million while upstream earnings also slip from the second-quarter $7,927 million. The $13.92 pace is what $210 capitalizes at about 15 times. That pace is a second-quarter rate with a large favorable timing effect inside it. If the timing effect reverses and refining margins cool toward the first-quarter experience, the earnings number the bull line requires fades, even with the multiple unchanged.
RelatedAmerican Express (AXP) Falls 3.67% After Outlook Raise
The bear line at $160 becomes the wrong reading if Energy Products holds near the second-quarter $5,465 million and any fresh mark-to-market stays far smaller than the $2,560 million timing effect in that quarter, while upstream keeps the crude-realization support the bridge already recorded. In that setting the first-half blend of $8.94 understates the run-rate, and a slip from 20.6 times to about 18 times is the harsh case. The bear reading is a de-rating on blended earnings. It loses force when the blend itself is the low number. The EDGAR submissions feed, opened on 27 October 2026, lists the 3 August 10-Q as the newest filing, so the September quarter is the document that can show which description is closer.
Questions on the frame
Why does a crude price make a weak stand-in for Exxon?
Upstream earnings rose 46.7 percent year on year, close to the 48 percent rise in the second-quarter average WTI price. Energy Products earnings rose to four times the year-ago figure while refinery throughput fell. In that same quarter the upstream derivative timing effect was a $180 million drag and the Energy Products timing effect was a $2,560 million gain. One barrel price flattens those differences into a single slope.
How was the $210 line set?
Second-quarter earnings were $3.48 a share. Four times that pace is $13.92. A multiple near 15 on $13.92 lands at $210, which is 13.8 percent above the $184.54 close. The multiple is lower than the 20.6 times the close places on a doubled first-half pace of $8.94. The bull line needs the second-quarter earnings rate to persist. It gives back some of the multiple the shares already carry on the blended half.
How was the $160 line set?
Doubling first-half earnings of $4.47 a share produces $8.94. About 18 times that figure is near $160, against 20.6 times embedded in the 26 October close. The line is 13.3 percent under the print. It also sits near the 30 April close of $154.33 and the 31 July close of $155.44. The bear case is a milder multiple on the blended half, which already mixes a weak derived first quarter with a strong second quarter.
How is the first-quarter Energy Products loss derived?
The 10-Q prints six-month Energy Products income of $4,203 million and second-quarter income of $5,465 million. The difference is a $1,262 million loss for the remaining quarter. The same subtraction puts upstream income at $5,737 million in that quarter, from a six-month total of $13,664 million. The company labels the columns as the quarter and the six months. The first-quarter split is arithmetic on those two columns, and the paths inside it diverged.
Which document is the latest filing used here?
The segment figures come from Exxon Mobil's Form 10-Q for the quarter ended 30 June 2026, filed on 3 August 2026. The EDGAR submissions feed, opened on 27 October 2026, lists that 10-Q as the newest filing. A September-quarter report was absent from the recent list on that feed. The share print is the StockAnalysis session close on 26 October 2026. The crude series are FRED daily observations through 20 October 2026, retrieved the following day.
These levels and multiples are a scenario frame built from a filing and a market print. They are not a recommendation to buy or sell Exxon shares or any other security.