

Having tracked Render (RENDER) from the Ethereum contract through the Solana upgrade, I do not treat a fast week as a new regime. CoinGecko put the token at $2.17 at 06:52 UTC on 13 October 2026, up 8.4% in 24 hours and 4.5% over seven days. That print sits 84.0% under the $13.53 all-time high of 17 March 2024, and it sits under the $3.05 daily close that opened this 365-day window on 14 October 2025. The question worth keeping is narrower than the candle. With 80.5% of the 644.2 million token cap already circulating, and with a published emission of 5.9 million RENDER running through 19 December 2026, does a move to $3.10 by year-end have a mechanism, or does $1.40, the close on 31 August, still own the downside? I have watched two rallies through this price fail inside the same year. The levels below are the test I will keep. They are not instructions.
The same CoinGecko file points both ways. The rolling 30-day change is +56.6%. The one-year change is −22.4%. Daily closes sharpen it: $1.37 on 14 September 2026, $2.17 now, $3.05 on 14 October 2025. Render has rallied inside a market still about 29% cheaper than its close of a year ago. Circulating supply was 518.8 million RENDER against a 644.2 million maximum. Year 3 of the burn-and-mint budget, in RNP-022, is 5.9 million tokens from 20 December 2025 through 19 December 2026, about 1.1% of the stock already out. At $2.17 that issuance is roughly $12.8 million against a $1.12 billion market cap: a scheduled drip, not a cliff, while job-linked burns do whatever usage does.
Key facts
- Spot $2.17, 24-hour range $2.00 to $2.22, market cap $1.12 billion, rank 72, reported volume $180.4 million — CoinGecko market data, 13 October 2026, 06:52 UTC
- Published changes: +8.4% in 24 hours, +4.5% in seven days, +56.6% in 30 days, −22.4% over one year — CoinGecko, same pull
- Highest daily close in the 365-day series was $3.05 on 14 October 2025; the lowest was $1.21 on 19 December 2025 — CoinGecko daily chart, retrieved 13 October 2026
- Two failed trips through the current zone: $2.58 on 12 January 2026, then $1.30 on 6 February; $2.29 on 27 May 2026, then $1.25 on 13 August — CoinGecko daily closes
- Year 3 emissions are 5.9 million RENDER, split 1.5 million grants, 1.5 million node rewards, 2.9 million operations, from 20 December 2025 to 19 December 2026 — RNP-022, Render Network Foundation, created 5 December 2025, status implemented
- Foundation dashboard showed 82,174,077 total frames rendered and 5,600 nodes since inception; the FAQ, read the same morning, still said "over 50 million frames" — stats.renderfoundation.com and renderfoundation.com/faq, 13 October 2026
A year spent under $3.05
The chart below is CoinGecko's daily series from 14 October 2025 to 13 October 2026, with three lines drawn only from today out to 31 December. Nothing on those lines is a CoinGecko forecast. The history is theirs. The levels are ours.
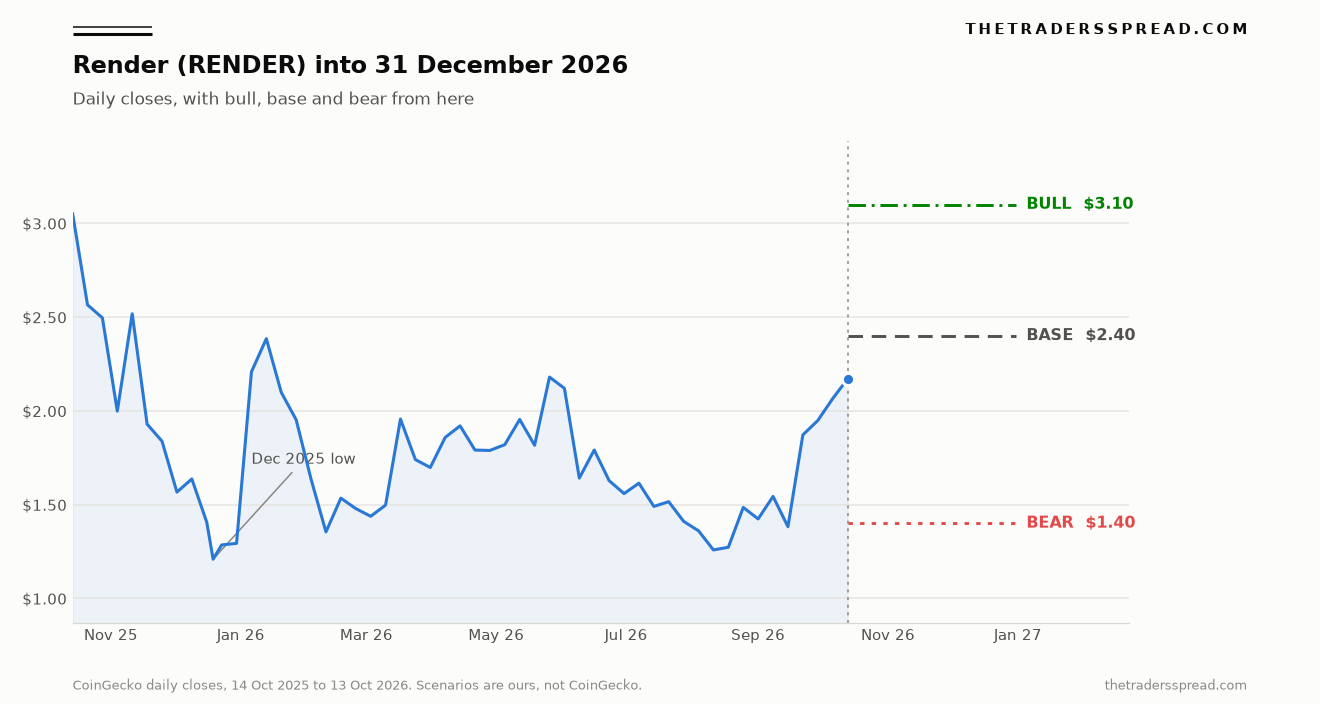
The first close in the window, $3.05 on 14 October 2025, is also the highest. From there the token fell to $1.21 on 19 December 2025, about 60% in nine weeks. That print is the low this map has to respect. $1.40 is a shelf. It is not the floor.
Two rallies have already failed above today's price. The close on 12 January 2026 was $2.58; on 6 February it was $1.30. The close on 27 May 2026 was $2.29; the summer low was $1.25 on 13 August. Each give-back was roughly 45% to 50% from the local high. The token is on a third approach to the same neighbourhood, this time off a September base rather than a December low.
The 30-day percentage is that September-October leg and nothing older. The 31 August close, which I am using as the bear case, was $1.40. The 14 September close was $1.37. From that shelf to $2.17 is the whole move a holder of six weeks is sitting on. It has not exceeded the January high or the May high. Calling it a breakout past the year's structure overstates the file.
| Path | Level | From $2.17 | What the series has to do |
|---|---|---|---|
| Bear | $1.40 | −35.5% | Give back the late-September rally and revisit the 31 August 2026 close |
| Base | $2.40 | +10.6% | Hold the zone that failed in May, and finish the year under the October 2025 high |
| Bull | $3.10 | +42.9% | Clear the $3.05 close of 14 October 2025 and hold a few cents beyond it |
No daily close in the last 365 days has printed $3.10. The bull case is a new high for this window, about 1.5% over 14 October 2025. The base at $2.40 sits between the May rejection near $2.29 and that old high. CoinGecko's rolling 30-day change of 56.6% is not the same object as the move from the $1.37 close on 14 September. Mixing them is how a tidy story picks up a fake extra point of precision.
Burns follow the job. Emissions do not.
Render's token machinery is a burn-and-mint equilibrium, not a simple unlock calendar. The Foundation FAQ, read on 13 October 2026, says node operators are paid for work completed and for time their machines are available. Separately, the network charges a 5% fee on completed jobs. Net fiat receipts are used to purchase RENDER, and that RENDER, together with any RENDER paid in directly, is burned.
The burn scales with usage. The emission does not. A quiet month still mints. The FAQ says early-year emissions were expected to exceed burns, with the unused portion kept in treasury rather than cancelled. That is a reserve, not a switch that turns supply down.
RNP-022, written by the Foundation on 5 December 2025 and marked implemented, fixes the current year. Year 3 copies Year 2's total: 5.9 million RENDER, 20 December 2025 through 19 December 2026. Artist and AI grants take 1.5 million. Node rewards take 1.5 million. Operations, research and growth take 2.9 million, which the proposal calls half the year. Half the new tokens are not a wage for a finished frame. They fund the institution.
Inside that node slice, the proposal keeps a weekly pace it says is already in force: 15,000 RENDER for job rewards and 2,800 RENDER for availability, 17,800 an epoch. At $2.17 that pool is about $38,600. The dollar figure is our arithmetic, not the Foundation's. Next to a $1.12 billion market cap it is a wage bill, not the thing that moved a 56% month.
Fully diluted value on the same CoinGecko pull was $1.16 billion, only a little above the $1.12 billion market cap, because most of the cap is already out. There is no locked tranche whose calendar would dominate the next ten weeks. Filecoin's scheduled cut in new FIL supply was a dated reduction the market could front-run. Render's Year 3 paper does not cut. It repeats 5.9 million. A supply shock into 31 December is an event this budget does not contain.
RNP-022 leaves a door. Allocations can be adjusted quarterly under an earlier proposal, RNP-013. A revision before 19 December would change this map. Until one exists, supply is a known 5.9 million. The same paper says the GPU industry is expected to reach $353 billion by 2030, from $83 billion in 2025, and it names no outside source. I am not adopting that sentence as a forecast. Only the 5.9 million is scheduled.
The people on the other side of a frame
A rendering job has two counterparties, and they do not want the same thing from the token on the day the frame finishes.
The creator wants a predictable invoice. Jobs are priced off OctaneBench, in euros, on tiers that trade speed against cost. Fiat receipts are converted and burned. If RENDER rises, the same euro of work burns fewer tokens. Frames can rise while the burn shrinks. A fuller frame counter is not, by itself, a statement about net supply.
The node operator wants the emission. Availability rewards pay for being online, on a weighted points system, not only for winning a job. A slice of issuance is a capacity payment. Machines are paid to wait. In a quiet week the availability mint still happens, and the burn, which follows completed jobs, does not keep pace.
Jules Urbach, founder and chief executive of OTOY, the company that started the network in 2017, described the job he wants on 2 June 2026: "a partial step to deterministic neural rendering, where a neural net, within its context window, ingests all artist scene graph inputs (texture maps, geo, lights, BDRF surfaces) & renders some / all complex light transport seamlessly in a path tracer." The source is his own post, awkward "BDRF" included. The token claim inside that sentence is narrow. The valuable job is a controlled scene, and the nodes do the heavy transport.
On 30 April 2025 he put a number on the cost hope: "I think we can further cut costs for media generation on Render down by 10x vs. current gen ai video if we can use our existing 3D workflows to control neural rendering output and scene composition." That line, from the same account, is an aim, not a measured invoice. I would not put a 10x into a model. Set beside the 5% fee, it shows what is missing: a published series of burns against the 5.9 million annual mint. The dashboard I opened on 13 October displayed frames and a lifetime node count. Circulating supply, maximum supply and cumulative burn did not load. Until they do, the burn side is a mechanism, not a current ratio.
A second network pays a different operator. The FAQ says RNP-019, in April 2025, set up a compute subnet, and that Dispersed.com "is now live, running jobs and rewarding nodes." RenderLabs, a for-profit partner from early 2025, chases commercial AI uses of that capacity. OTOY remains the rendering partner. One emission budget, three institutions. A rally filed as AI still has to name which desk burns the tokens.
Bittensor's bull and bear map prices a subnet market for machine-learning work. Render prices a burned job invoice plus a wage for GPUs that show up. Both get filed under AI compute. A move in one is not evidence about the float of the other.
Nvidia's last guidance print is the centralised version of the same cycle, booked by the chip designer. Render's FAQ pitch is the idle consumer card. If the work moves onto data-centre GPUs, that pitch thins out while the AI headline gets louder. RNP-022 expected a wider compute rollout in 2026. Expectation is not throughput.
The 30-day candle, read against the float
A token up 56.6% in 30 days, with a dashboard north of 82 million frames, gets called a usage breakout. Some of that may be fair. The parts that do not follow from the evidence are the ones that leak into a year-end target.
Frames are a stock, not a flow. 82,174,077 total frames, the dashboard figure on the morning of 13 October 2026, does not say how many frames cleared last week. The FAQ's "over 50 million," read the same morning, shows the marketing page lagging the counter. That is a reason to prefer the dashboard. It is not a growth rate. I do not have the weekly flow, and I will not invent one.
"5,600 nodes since inception" has the same shape. The label is lifetime, not active. An operator who connected in 2021 and left is still in a since-inception tally. Reported turnover has a similar problem of interpretation. CoinGecko showed $180.4 million of volume against a $1.12 billion market cap, about 16% of that value in a day. I do not have a primary study that separates real trade from noise, so the figure stays a turnover fact. It does not get promoted to demand.
The upgrade from Ethereum RNDR to Solana RENDER is mostly behind this move. RNP-022, reviewing 2025 through October, said 77% of tokens had migrated and that 423 million RENDER had been upgraded. CoinGecko's total supply now is 533.5 million. That migration is a poor explanation for a repricing that started in mid-September 2026.
The repricing lines up with the end of a flat summer, not with a new supply event. From $1.25 on 13 August to $1.37 on 14 September the token barely moved, then it stepped through $1.91 on 1 October to $2.17 this morning. Prior trends in this file lasted weeks. A path that needs the 30-day slope to survive into December asks for a duration the series has not produced.
RelatedCosmos (ATOM) Price Prediction: $2.44 Bull vs $1.40 Bear
Four-fifths of the cap is already out, so a modest change in the willingness to hold moves the price, and the same modesty works in reverse. The Year 3 emission, roughly $12.8 million across the whole window, is not the inventory. The 518.8 million already circulating is. The bullish version of that fact is real and limited: a network that burns against a job fee can be worth more than $2.17 if the jobs grow. Euro usage in the Year 3 paper was up 87% in 2025 versus the same stretch of 2024, with a warning that the fourth quarter of 2024 had been heavy. That sentence is about 2025. It is not this month's growth rate.
Three paths to 31 December
This render price prediction stops on 31 December 2026 and leaves the March 2024 high of $13.53 alone. The weights are a judgement on the evidence above, not an options price and not a reason to transact.
The base path, at 45%, finishes at $2.40, 10.6% above the $2.17 spot. The third visit to the low $2s does not collapse at once. Price holds the $2.00 to $2.22 band from the last day, edges up, and finishes beneath the $3.05 close that caps the window. $2.40 sits under the January extreme of $2.58. It needs November to avoid a repeat of February, when $2.58 became $1.30.
The bull path, at 25%, is $3.10, 42.9% above spot and about 1.5% above the $3.05 close of 14 October 2025. The September trend has to extend, and a pass through $3.05 has to hold. A spike that closes back near $2.50 is not this path. At $3.10 the token would still sit about 77% under $13.53.
The bear path, at 30%, is $1.40, 35.5% under spot and almost the 31 August close. December 2025 printed $1.21 and 13 August printed $1.25, so this hands back the autumn rally. The last two trips through today's price gave back roughly 45% to 50% from the local high. A 35% decline from here is milder than either, which is why the bear stays under the base, and those reversals happened on an unchanged emission schedule, which is why the weight is not small.
Weighted, the centre is about $2.28. The bias is bull and the conviction is 3 out of 5, because the modal path is the base and the bull is only the tail that would change the one-year picture. A daily close under $1.40 retires the base and the bull. A daily close above $3.10 makes that figure a level to hold, not a destination. A quarterly change to the 5.9 million budget, which RNP-022 allows, or a published burn against the 17,800 RENDER weekly mint, would move the weights. A green 24-hour candle would not. The seven-day change is only +4.5%.
Questions the levels leave open
What does this Render price prediction actually cover?
It covers the path from the $2.17 CoinGecko spot on 13 October 2026 to 31 December 2026. The bull case is $3.10, the base case is $2.40, and the bear case is $1.40. The weights are 25%, 45% and 30%. Nothing in those numbers is an order, and nothing in them reaches the March 2024 high of $13.53.
Why is the bull case $3.10 rather than a return toward the old high?
Because no daily close in the last year has been above $3.05, and $3.05 was the close on 14 October 2025, the first day of this window. $3.10 is that high plus a few cents. A target near $13 would ignore a file in which two rallies, to $2.58 and $2.29, both failed. The bull case has to clear a range the market has already defined.
Is $1.40 a crash call?
No. It is the 31 August 2026 daily close, six weeks before this note, and it is still above the $1.21 low of 19 December 2025 and the $1.25 low of 13 August 2026. From $2.17 it is a 35.5% decline. That is painful, and it is milder than the give-back after the January high and the give-back after the May high.
How can usage rise without tightening the float?
Jobs are priced in euros off OctaneBench. The Foundation says fiat receipts are converted into RENDER and burned, after a 5% fee. If the token price rises, the same euro of work burns fewer tokens. Frames can set a record while the burn shrinks. Emissions of 5.9 million RENDER for Year 3 are on a schedule, so they arrive whether or not the frames do.
What single missing number would change the weights?
Epoch burns against the 17,800 RENDER weekly node mint in RNP-022. The dashboard opened on 13 October 2026 showed 82,174,077 cumulative frames and 5,600 nodes since inception, and it did not show a current burn. Without that ratio, the bull case is a price path through $3.05, not a demonstrated shortage of tokens.
Disclaimer. This is analysis, not advice. Render (RENDER) is volatile, the scenarios can fail, and capital is at risk. Levels are conditional on the sources named above. Nothing here is an instruction to trade.