

Chevron earnings in the quarter covered by the latest Form 10-Q put upstream at 53.61 percent of segment earnings and downstream at 46.39 percent. Total upstream earnings were $5,698 million and total downstream earnings were $4,931 million. Those two figures are the whole of the $10,629 million the filing labels total segment earnings for the three months ended September 30, 2026. We divided each segment by that total, using the Earnings by Business Segment table on page 27. All Other, a charge of $705 million, sits outside that total, so the share is a split of the two operating segments only.
Note 7 on page 12 of Chevron's Form 10-Q for the quarter ended September 30, 2026 prints the lines that add to the upstream figure: U.S. upstream net income attributable to Chevron of $3,293 million and international upstream of $2,405 million. Data as of November 5, 2026, the day the company filed that report. Four questions follow from that split.
Which segment earned the money?
The page 27 table is the one to read first, because it is already after tax and it is already net of noncontrolling interests. U.S. upstream earned $3,293 million, international upstream $2,405 million, U.S. downstream $3,585 million and international downstream $1,346 million. The same four lines a year earlier were $1,282 million, $2,020 million, $638 million and $499 million. Total segment earnings then were $4,439 million, against $10,629 million this quarter, and net income attributable to Chevron was $9,924 million against $3,539 million.
| After-tax earnings, millions of dollars | Three months ended Sept. 30, 2026 | Three months ended Sept. 30, 2025 |
|---|---|---|
| U.S. upstream | 3,293 | 1,282 |
| International upstream | 2,405 | 2,020 |
| Total upstream | 5,698 | 3,302 |
| U.S. downstream | 3,585 | 638 |
| International downstream | 1,346 | 499 |
| Total downstream | 4,931 | 1,137 |
| Total segment earnings | 10,629 | 4,439 |
| All Other | (705) | (900) |
| Net income attributable to Chevron | 9,924 | 3,539 |
Inside this quarter's segment total, U.S. upstream is 30.98 percent, international upstream 22.63 percent, U.S. downstream 33.73 percent and international downstream 12.66 percent. U.S. downstream is the single largest geographic line. Of upstream alone, the United States is 57.79 percent and international operations are 42.21 percent. Of downstream alone, the United States is 72.70 percent and international operations are 27.30 percent. The same division on the year-ago quarter puts upstream at 74.39 percent of segment earnings. On the nine-month columns of the same table, upstream is $17,789 million of $26,771 million, or 66.45 percent. A reader who carries either of those older mixes into this quarter will mis-state where the money sat.
Page 28 still says earnings depend mostly on the profitability of the upstream segment, and a 53.61 percent share is still the larger of the two, which this quarter tests. Downstream closed a gap that was wide a year earlier, on the refined-product margins page 35 quantifies.
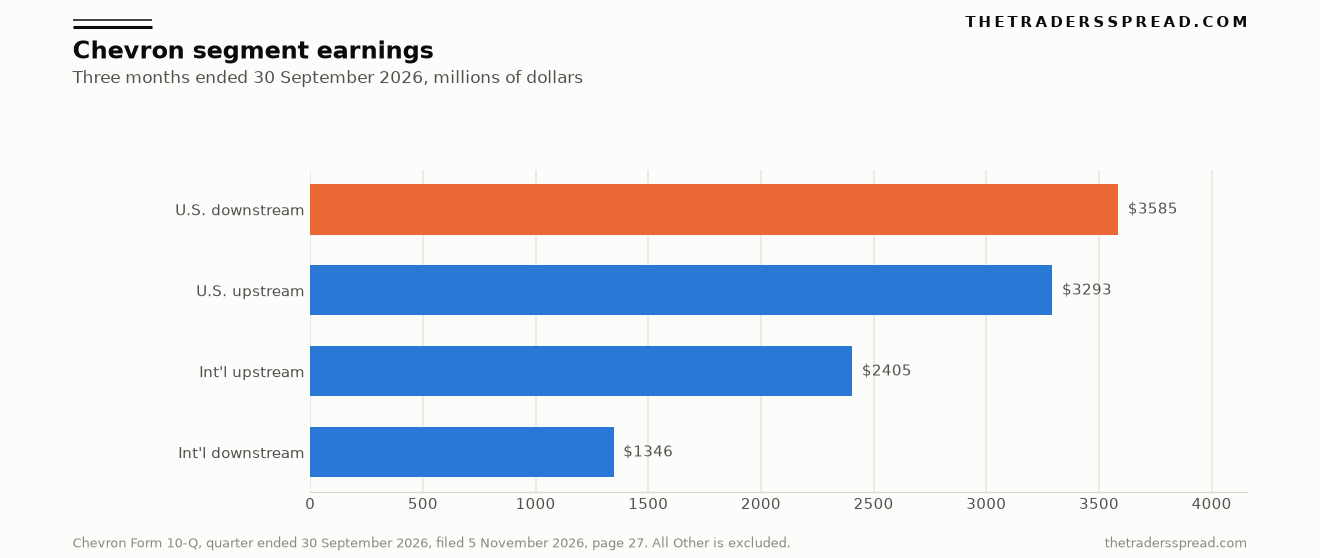
All Other stays off the bars because it sits outside total segment earnings. On the income statement, page 3, the $9,924 million is diluted earnings of $5.06 a share on 1,962,905 thousand diluted shares. Note 10 on page 16 puts the effective tax rate at 26 percent for the quarter, against 33 percent a year earlier, on a shift in the mix of tax-rate jurisdictions.
A footnote on the page 27 table puts foreign-currency effects at a $143 million decrease in earnings for the quarter. The October 30, 2026 earnings release filed as Exhibit 99.1 also prints adjusted earnings of $10,361 million, or $5.28 a diluted share. That adjusted total is a non-GAAP figure in the release, not the earnings line Note 1 defines, which is net income attributable to Chevron. The release says the quarter included a legal reserve of $160 million and an impairment of $110 million. Page 34 already places both inside the international upstream variance, so both sit inside the $2,405 million that feeds the 53.61 percent.
Chevron's own account posted the results announcement on October 30, 2026, six days before the 10-Q. The post points at the press release. The segment shares in the opening are computed from the filing's table, which carries the same upstream and downstream totals the release had already shown.
$CVX announces third quarter 2026 results. Read the press release: https://t.co/TktajB9IT3 pic.twitter.com/uteRnfgBtX
— Chevron (@Chevron) October 30, 2026
"We delivered strong operational performance and disciplined execution, while continuing to invest to grow energy supply," said Mike Wirth, Chevron's chairman and chief executive officer, in that release. The next sentence, still in the release and outside the quotation marks, says U.S. upstream production exceeded 2 million barrels of oil equivalent a day for a fifth consecutive quarter. The 10-Q prints 2,043 thousand barrels of oil equivalent a day in the United States, on page 34. The round number and the table are the same fact at two precisions. A line-by-line reading of Lam Research earnings is the same habit: take the table in the filing, then see which sentence in the release restates it.
What upstream production does the filing print?
Worldwide net oil-equivalent production was 3,980 thousand barrels a day in the quarter, against 4,086 thousand a year earlier, a decline of 106 thousand barrels a day. The United States was 2,043 thousand, up 3 thousand. International production was 1,937 thousand, down 109 thousand, which page 34 calls 5 percent. The nine-month worldwide average on page 40 is 3,970 thousand barrels a day, and page 32 rounds that to 3.97 million, up 10 percent from a year earlier on the Hess acquisition and growth in the Gulf of America and the Permian Basin, partly offset by lower production at Tengizchevroil.
| Operating line | Unit | Q3 2026 | Q3 2025 |
|---|---|---|---|
| U.S. net oil-equivalent production | thousand boe/d | 2,043 | 2,040 |
| International net oil-equivalent production | thousand boe/d | 1,937 | 2,046 |
| Worldwide net oil-equivalent production | thousand boe/d | 3,980 | 4,086 |
| U.S. liquids production | thousand bbl/d | 1,456 | 1,496 |
| U.S. natural gas production | million cubic feet/d | 3,522 | 3,265 |
| International liquids production | thousand bbl/d | 1,010 | 1,099 |
| International natural gas production | million cubic feet/d | 5,563 | 5,674 |
| U.S. liquids realization | dollars per barrel | 62.72 | 48.12 |
| International liquids realization | dollars per barrel | 86.09 | 63.16 |
| U.S. refinery crude inputs | thousand bbl/d | 1,093 | 1,064 |
| International refinery crude inputs | thousand bbl/d | 665 | 663 |
The gas lines convert at the rate in footnote 2 on page 40: 6,000 cubic feet of natural gas equals one barrel of oil. U.S. liquids of 1,456 thousand barrels a day plus 3,522 million cubic feet a day divided by six equals the 2,043 thousand oil-equivalent barrels. International liquids of 1,010 plus 5,563 divided by six round to the 1,937 the table prints. Sales of natural gas were 5,982 million cubic feet a day in the United States, above net production of 3,522, because sales include purchased gas.
Realizations explain why upstream earnings rose while worldwide barrels fell. U.S. liquids realization was $62.72 a barrel against $48.12, and international liquids were $86.09 against $63.16. Page 34 says U.S. upstream earnings increased by $2.0 billion, on higher liquids realizations of $1.5 billion and lower operating expenses of $590 million, including the absence of $245 million of prior-year Hess severance and transaction costs. The small U.S. barrel increase is the Gulf of America ramp-up at Ballymore, Whale and Anchor, partly offset by lower Bakken production.
International upstream earnings increased by $385 million. Page 34 lists higher realizations of $2.2 billion and higher Venezuela liftings of $470 million, set against unfavorable timing of $1.1 billion, taxes of $310 million, foreign currency of $222 million, the legal reserve and the impairment. The volume decline is lower entitlements from higher prices and the Middle East conflict, partly offset by record production in Australia and one month of Venezuela production after the joint ventures moved to equity accounting on September 1, 2026. Page 30 says that accounting change leaves the amount and timing of earnings recognition broadly as they were. Adding a full quarter of Venezuela barrels on top of the month already inside the 1,937 thousand would double-count September.
"We're reinvesting to bring more energy to a supply-constrained market," Wirth said in the same release. The capital-expenditure table on page 43 shows $4,011 million for the quarter: U.S. upstream $1,667 million, international upstream $1,920 million, U.S. downstream $250 million and international downstream $64 million. U.S. downstream, the largest earnings line, took the smaller capital cheque.
Page 31, sourcing Platts for crude and Energy Intelligence for gas, puts Brent at a $94 average for the first nine months of 2026 against $71 a year earlier, and about $96 on November 4, 2026. West Texas Intermediate averaged $84 against $67 and was about $88 that day. Henry Hub averaged $3.49 per thousand cubic feet in both nine-month periods and was about $2.63 on November 4. For every dollar of change in Brent, annual after-tax earnings and cash-flow sensitivity is about $600 million, a company-wide figure covering both segments together.
What did downstream and chemicals print?
Downstream is one reportable segment, and chemicals sit inside it. Page 32 defines downstream earnings as margins on refining, manufacturing and marketing, including petrochemicals. Page 27 has no chemicals column beside upstream and downstream. Chevron Phillips Chemical Company LLC, the 50 percent-owned affiliate, is held inside Chevron U.S.A. Inc. and accounted for under the equity method, which Note 6 states. The quarterly discussion on page 35 attributes the $2.9 billion U.S. downstream increase to refined-product margins and leaves CPChem inside that total. The nine-month discussion is more specific: higher earnings from CPChem of $390 million sit inside a $5.0 billion nine-month increase, partly offset by higher litigation reserves of $190 million. The $390 million is the change against the prior nine months, and the affiliate's quarterly level stays inside the equity-method total.
The balance sheet is a different page and a different unit. Chemicals inventories were $713 million at September 30, 2026, against $571 million at December 31, 2025, on page 5. The $713 million is the inventory balance. Quarterly earnings for the operating segments live on page 27. The same caution applies to any single product row pulled out of a consolidated total, which is the point of reading Snowflake's product-revenue line as one audited row rather than as the whole company.
U.S. refinery crude-unit inputs were 1,093 thousand barrels a day, up 29 thousand from 1,064 thousand. Page 35 says the refineries ran at record levels near capacity. The earnings release adds the utilization: throughput of 1.09 million barrels a day and crude-unit capacity utilization of nearly 98 percent. Refined-product sales were 1,304 thousand barrels a day against 1,303 thousand, with gasoline at 670 thousand against 676 thousand and other products at 634 thousand against 627 thousand, both on page 40. Flat sales beside the $2.9 billion earnings increase is the margin story the management discussion names.
International refinery inputs were 665 thousand barrels a day against 663 thousand. Refined-product sales were 1,388 thousand against 1,517 thousand, down 9 percent, which page 35 ties to supply disruption from the Middle East conflict. International downstream earnings were still $1,346 million, up from $499 million, because margins outweighed the lost volumes and the $370 million timing effect.
Income from equity affiliates was $2,097 million against $981 million on page 3. Note 7 splits the quarter into international upstream $1,247 million, U.S. downstream $365 million, international downstream $488 million and a $3 million U.S. upstream loss, which add to $2,097 million. Page 37 names Tengizchevroil, Petropiar after the September 1 equity-method change, GS Caltex and CPChem, and leaves the dollars in those segment lines. Note 5 prints 100 percent of Tengizchevroil: nine-month net income attributable to the venture was $4,618 million against $2,209 million. Chevron's own result is the equity-income line, so the venture total stays at the 100 percent the note labels.
"This transaction resets the commercial framework between our upstream and midstream assets in the Bakken and DJ Basins," said Andy Walz, Chevron's president of downstream, midstream and chemicals, in the October 6, 2026 release attached to the company's Form 8-K. "It lowers our Bakken cost structure while positioning Hess Midstream to advance as an independent company." Walz's title is the organizational home of chemicals and of the midstream contracts. The 10-Q's segment map is still two lines. Note 19 on page 26 records the same agreements and puts the earnings effect at closing, after this quarter.
RelatedBooking BKNG vs Expedia EXPE on Take Rate and Room Nights
The October 5, 2026 Form 8-K names the officers over that map from January 1, 2027. Eimear Bonner, now chief financial officer, becomes president of oil, products and gas. Jeff Gustavson, now president of new energies, becomes chief financial officer. Mark Nelson remains vice chairman and adds strategy and business development. Those elections leave this quarter's segment table as filed. Amit Ghai, controller, signed the 10-Q on November 5, 2026. Item 4 says the chief executive and the chief financial officer found disclosure controls effective as of September 30, 2026.
What does the filing say about the dividend and the buyback?
The cash-flow note on page 10 says the company paid dividends of $1.78 a share in the third quarter of 2026, against $1.71 a year earlier. The equity statement on page 7 shows $3,482 million of cash dividends to Chevron stockholders for the three months, and $10,512 million for the nine months, which page 41 rounds to $10.5 billion. In October 2026 the company declared another $1.78 a share, payable in December 2026. The earnings release dates that payment to December 10, 2026, for holders of record on November 18. The declared rate matches the rate already paid.
The repurchase program is on page 42. On January 25, 2023 the board authorized $75 billion of repurchases, effective April 1, 2023, with no fixed expiration. The company has bought 294 million shares for $46.5 billion under that authority, including 12.9 million shares for $2.5 billion in the third quarter. The same paragraph says Chevron expects fourth-quarter repurchases of $2.5 billion to $3.0 billion, and then conditions the range: purchases depend on price and markets, the program obliges no particular amount, and the company may discontinue or resume it at any time. Page 41 lists the levers in a long stretch of low crude and gas prices and narrow margins: modify capital spending, curtail or stop the repurchase program, sell assets, borrow, and still pay the common dividend.
The issuer table on page 46 is the monthly record. The quarter's purchased total is 12,874,161 shares at an average of $194.31, of which 12,865,359 were under the public program, and authority left at September 30 was $28.5 billion. The average price stepped from $180.07 in July to $207.51 in September.
What would change the reading of the segments?
The 53.61 percent is a property of this quarter's table. Four things already disclosed in the filing would move a later reading, and each of them is a line in a future report rather than a price for the shares.
The Hess Midstream loss is the largest. Note 19 expects an after-tax loss of about $3 billion to $4 billion at closing, with the removal of about $13.2 billion of assets, $5.4 billion of liabilities including $3.7 billion of debt, and $4.7 billion of noncontrolling interests. This quarter ends before that closing. Placing the loss in All Other would leave the 53.61 to 46.39 split standing while net income falls. Placing it inside upstream or downstream would move the split. The Bakken cost saving of about 50 percent would arrive later as lower upstream cost. A signed sale of downstream assets in Singapore and other Asian markets, noted on page 29 and expected to close in 2027, would remove international downstream volumes, and the filing leaves those assets' current earnings for a later report.
Timing effects are the second swing. Page 30 marks economic hedges to market while the physical barrels wait for delivery, and LIFO accounting adds a further non-cash effect. The combined timing line was unfavorable by $1.6 billion in the third quarter, after a favorable $1.5 billion in the second and an unfavorable $2.9 billion in the first, and the company says the difference is expected to unwind. International upstream already includes $1.1 billion of that timing, and international downstream includes $370 million. An unwind would lift earnings in one or both segments with no matching change in the 3,980 thousand barrels a day. Treating that line as a permanent margin misreads the page. The same separation of a reported book from the line that moved is what Honeywell and Emerson on the segment margin line asks of two industrial filings.
The third swing is the price. Page 30 says upstream earnings line up with crude, natural gas and natural gas liquids prices set outside the company. Downstream margins can move the other way, because crude is the largest cost in a refined product. This quarter did both: liquids realizations rose, and U.S. refined-product margins contributed $2.9 billion. The $600 million annual sensitivity per dollar of Brent covers the company as a whole. Page 34 already shows higher prices cutting international barrels even as realizations lifted international upstream earnings, so a higher Brent can raise the dollar line and lower the barrel line together.
The fourth is the wrong column. Nine-month upstream is 66.45 percent of segment earnings, and the year-ago quarter is 74.39 percent. Both sit in the same table, and in both periods upstream carried more of the total than it did in the three months ended September 30, 2026. A later quarter uses the same division: total upstream and total downstream over total segment earnings, with All Other outside the ratio. A release that rounds net income to $9.9 billion, as the October 30 exhibit does, is a headline, and the segment percentage lives in the table. Parsing a release against the filing is the same job as parsing a Shopify earnings report, with Chevron's downstream line holding chemicals, refining and marketing together.
This is analysis of Chevron's quarterly filing, not advice. Capital put at risk can be lost.