

I have kept a Pendle tab open on my desk since the 2024 points mania, mostly because it is the one DeFi book where you can watch a narrative and a cash flow come apart in real time. This month they came apart badly. PENDLE changed hands at $2.7090 at 06:51 UTC on 19 September 2026, up 86.67% from its $1.4512 daily close on 20 August, according to CoinGecko's daily series pulled two minutes later. Pendle's own price API returned $2.69052 at 06:58 UTC, so the tape is not in dispute. What is in dispute is what the tape is supposed to represent. A yield-tokenisation protocol that nearly doubles in a month is usually doing more business, winning deposits it can charge on, or pulling stakers in behind a shortening float. This one is doing less of the first, almost none of the second, and none at all of the third.
Here is the number that sent me back through the data three times. On 20 August, the day before the run started, 99.10 million PENDLE sat staked. On 19 September, after the token had gained 86.67%, 98.19 million sat staked. The dollar value of that stake rose 85.0%, which is the figure that gets screenshotted, but the token count fell 0.9%. Not one net coin was locked into the rally. The people who already owned the claim on Pendle's buyback did not add to it, and the people buying the token were not converting into the thing that receives the buyback. Over the same thirty days, protocol fees fell 10.4%.
Key facts
- PENDLE spot $2.7090, up 86.67% from the 20 August daily close of $1.4512 and down 47.41% from $5.1512 a year ago — CoinGecko daily closes, retrieved 06:53 UTC, 19 September 2026
- Protocol fees of $634,802 over the last 30 days, against $708,516 in the prior 30 — DefiLlama fee series, 19 September 2026
- Total value locked $1.27bn, up 8.5% in 30 days but down 90.5% from $13.39bn on 19 September 2025 — DefiLlama, 19 September 2026
- 98.19m PENDLE staked, against 99.10m on 20 August — DefiLlama staking series divided by that day's CoinGecko close, 19 September 2026
- 80% of Pendle V2 yield and swap fees are routed to open-market PENDLE buybacks, with 10% each to treasury and operations — Pendle documentation, retrieved 19 September 2026
- Robinhood Chain, the headline September catalyst, generated $61 of protocol fees in 30 days — DefiLlama chain breakdown, 19 September 2026
- Market capitalisation $470.2m on 173,577,698 circulating tokens; fully diluted $761.5m — CoinGecko, 06:53 UTC, 19 September 2026
What the protocol actually charges for
Pendle splits a yield-bearing asset into two tradeable pieces: a principal token that redeems one-for-one at maturity, and a yield token that collects everything the asset earns until then. It is the zero-coupon strip and the coupon strip, rebuilt on-chain. The physical version has existed for seventy-five years, which is why the photograph at the top of this piece is a 1950 Indonesian government bond sitting next to its sheet of detachable 3% coupons.
The revenue model is narrow and easy to audit. Pendle's fee documentation, retrieved 19 September 2026, names two lines. The protocol takes 5% of all yield accrued by every yield token in existence, points included. It also takes a swap fee on principal-token trades, scaled by time to maturity on the formula (Fee Tier / 365) × Days to Maturity, so a market three weeks from expiry is worth a fraction of what the same notional was worth a year out.
Twenty per cent of swap fees go to the pool's liquidity providers. Everything left, plus all yield-token fees, splits 80/10/10 between a PENDLE buyback fund, the protocol treasury and operations. The sPENDLE page describes the plumbing precisely: fees are harvested every two weeks into buyback contract 0x9e08C5499f953C6297A7755BcBcEd383b606896b, the contract buys over the following week on a one-hourly TWAP, and the purchased tokens are distributed to active stakers fortnightly.
That is a clean design. It also means the token's entire claim is a fixed percentage of a variable number, and it is the variable number that matters.
The rally against its own fundamentals
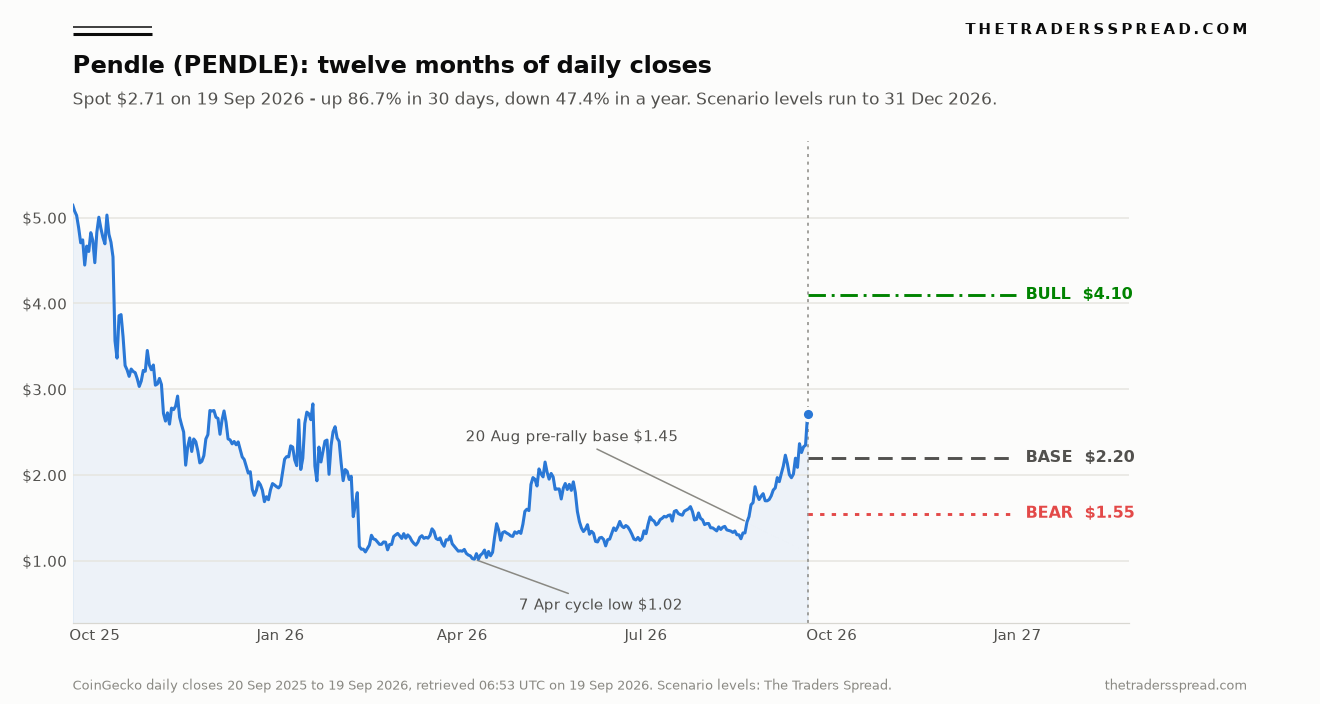
Four series, four windows, one chart. The price line below runs from 20 September 2025 to the live print, with the scenario levels discussed further down projected to the end of the year.
| Window | PENDLE price | TVL | Protocol fees | PENDLE staked |
|---|---|---|---|---|
| 30 days (from 20 Aug) | +86.67% | +8.5% | −10.4% | −0.9% |
| 90 days (from 21 Jun) | +91.97% | +29.9% | −39.1% | −2.6% |
| Year to date (from 1 Jan) | +44.00% | −65.6% | −53.0% | +44.2% |
| 12 months (from 19 Sep 2025) | −47.41% | −90.5% | −47.1% | +62.6% |
Price from CoinGecko daily closes; TVL and fees from DefiLlama; staked tokens derived by dividing DefiLlama's staking series by that day's close. All retrieved 19 September 2026. The 30-day and 90-day fee cells compare each window's total with the preceding equivalent window. The year-to-date fee cell compares January 2026's $1,234,716 with September's 30-day run-rate of $580,915. The 12-month cell compares trailing-year fees of $18,870,370 with $35,648,757 the year before.
The year-to-date column is the one worth sitting with. TVL is down roughly two thirds since January, the monthly fee run-rate is down 53%, and the token is up 44%. Staking grew 44% over the same span, which sounds like a rebuttal until you check when it happened: the stake went from 68.11m tokens on 1 January to 99.30m on 7 April, and has gone nowhere since. Between 7 April and today it is down 1.1%.
Monthly fee totals make the trend blunt. October 2025 produced $4,365,003. July 2026 produced $629,737, August $695,385, and the first nineteen days of September $367,913. Trailing twelve-month fees are $18,870,370, against $35,648,757 in the twelve months before that; the last thirty days annualise to $7.72m. On the current $470.2m market capitalisation, that is 60.9 times the run-rate fee take, or 24.9 times the trailing year. Holders' revenue, the slice that actually reaches stakers after the treasury and operations cuts, ran $465,153 over thirty days and $14,220,108 over the year.
Where the new money went, and what it paid
The TVL recovery is real, and it is almost entirely a chain-expansion story rather than a demand story. DefiLlama's chain breakdown, read at 06:53 UTC today, puts Ethereum at $722.3m, Monad at $206.3m, Arbitrum at $155.0m, X Layer at $69.1m, Plasma at $65.2m and Hyperliquid L1 at $42.0m. A year ago the same protocol held $11.25bn on Ethereum alone.
X Layer went from $6.1m on 20 August to $68.9m on 18 September. Monad, which did not carry Pendle deposits before August, sits above $200m. Against that, Plasma fell from $129.3m to $65.7m across the same weeks. Net the movements and the thirty-day TVL gain of roughly $100m is a reshuffling of incentive-chasing deposits between new deployments, not fresh capital arriving at the fee-bearing core.
Now match the deposits to the takings. Over thirty days Ethereum produced $478,579 of fees, Arbitrum $71,440, Monad $39,297 and Plasma $31,309. X Layer, holding $69m, produced $141. Robinhood Chain, the deployment that carried the September headlines, produced $61.
Sixty-one dollars.
That is not a criticism of the launch, which is six weeks old and was never going to be material this quarter. It is a criticism of the reflex that treats a new chain deployment as a re-rating event. We have watched this precise film before on this desk: Uniswap rose 128% on Robinhood Chain fee expectations and then gave back 18% when the fees arrived. Pendle's own Pendle Print #125, published 14 September 2026, dates the Robinhood Chain go-live to a 7 September post and the first tokenised stock dividend markets, an October Nvidia expiry and a December Pfizer expiry, to 9 September. Those are genuinely novel instruments. They are also two markets.
The buyback is real. Its size is the argument.
The bull case for PENDLE is not TVL. It is the buyback, and the buyback deserves a serious hearing because the mechanism is documented, the contract is public and the execution is verifiable. In a post dated 14 September 2026 and reproduced in its own newsletter, Pendle stated: "In just ~7 months, $PENDLE buyback has already passed 2.8M ($4M)." The same post put emissions "down 78% since the start of the year, translating to ~0.5% annual inflation vs. >1.5% buyback YTD."
Take the protocol at its word and do the arithmetic it invites. 2.8 million tokens is 1.61% of the 173.58m circulating supply, bought over roughly seven months. Four million dollars across seven months is about $571,000 a month. Protocol revenue over the last thirty days was $618,326. The buyback has therefore been consuming somewhere around ninety per cent of what the protocol earns, which is exactly what an 80% allocation plus timing lag should produce, and which means the bid cannot grow unless the fee line grows.
There is a second, less comfortable number inside the same claim. $4m for 2.8m tokens implies an average acquisition price near $1.43. Spot is $2.7090. Every dollar of fees now buys back 47% fewer tokens than the year-to-date average has, so a flat fee line produces a shrinking supply effect at exactly the moment the narrative needs it to scale.
I also found the two primary sources disagreeing on emissions, and it is worth flagging rather than smoothing over. Pendle's tokenomics page, retrieved today, still describes the September 2024 baseline of 216,076 PENDLE a week decaying 1.1% weekly until April 2026, "at which point it will switch to a terminal inflation rate of 2% per annum for incentives." The 14 September post says actual inflation is running near 0.5%. Both are the protocol's own words. The documentation appears to be stale, and a reader relying on it would overstate dilution by a factor of four. I could not verify the current weekly emission at a contract-level source, so I am reporting the gap rather than picking a side.
What nobody staked into
Back to the staking series, because it is the disconfirming evidence for my own bearish lean as much as the supporting evidence.
The stake is structurally large. 98.19m PENDLE is 34.9% of the 281,527,448 total supply, which I confirmed on-chain at Ethereum block 26,010,429 and which matches CoinGecko's figure to the token. Add the 173.58m circulating float and roughly 9.7m in ecosystem, governance and team addresses and the supply reconciles. A third of the token locked behind a fourteen-day cooldown, or a 5% instant-exit penalty, is a genuine float constraint, and it is a large part of why a $470m asset can move 86% in a month on $97m of daily volume.
But the composition is odd. The legacy vePENDLE contract at 0x4f30A9D41B80ecC5B94306AB4364951AE3170210 still held 63,593,587 PENDLE when I queried it this morning, which is 22.6% of total supply and roughly 65% of everything staked. The documentation describes that contract as "winding down — users should migrate to sPENDLE", with voting power mirrored across as virtual balances. Nearly two thirds of Pendle's staked supply is sitting in the old locker eleven months into a migration. That is not the behaviour of a holder base actively repositioning around a new buyback mechanism. It is the behaviour of a holder base that has stopped clicking.
The related reading here matters: Pendle's ecosystem vault on Morpho, co-curated with Wintermute and quoted at 6.11% total APY in the protocol's 3 September post, sits inside a lending market whose own deposit growth we covered in August, and the fixed-yield competition Pendle prices against runs through Aave's $31bn deposit base. Boros, the funding-rate swap venue on Arbitrum, is the most interesting thing Pendle has built since the yield token itself, and it generated $37,065 of fees in thirty days against $715,944 over the trailing year. The tokenised-dividend work extends the same logic that drove Ondo's move on the SEC's tokenised-stock order. None of it is fake. All of it is small.
RelatedNumeraire (NMR) Rises 38.7% to $16.59 as Turnover Jumps
The call
My base case is $2.20 by 31 December 2026, roughly 18.8% below spot, with 45% probability. That is not a collapse thesis. It is the level at which a $381.9m market capitalisation sits at 26.9 times trailing holders' revenue, which is where PENDLE has spent most of the past six months, and it assumes the buyback and the reduced emission schedule keep a floor under the token while the re-rating premium bleeds off.
The bear case is $1.55, 42.8% below spot, at 25% probability. It needs one thing: the September fee bounce on Ethereum, where thirty-day fees rose 23% month on month to $478,579, turns out to have been maturity-cycle timing rather than a trend. If the fee line resumes its slide toward the July print of $629,737 a month, the buyback shrinks in dollar terms while buying at double its year-to-date average price, and $1.55 returns the market capitalisation to $269.0m, or 18.9 times trailing holders' revenue. The 20 August base of $1.4512 sits just underneath.
The bull case is $4.10, 51.3% above spot, at 30% probability. It requires the product pipeline to convert. Permissioned institutional markets, the curator module, tokenised dividends and Boros all route fees into the same 80% buyback, and $4.10 implies a $711.7m market capitalisation at 50 times trailing holders' revenue, which is not an absurd multiple for an asset whose fee base is doubling. The immediate test is the 2026 closing high of $2.8285 set on 17 January, 4.4% above spot.
What would change my mind: a thirty-day fee total above $1.1m, or staked token count breaking above 105m. Either would tell me capital is doing something rather than watching. A decisive weekly close above $2.8285 would tell me the market has accepted the re-rating regardless of what I think of it, and at that point the base case is wrong.
FAQ
Why do the percentage moves here differ from the ones on price sites?
CoinGecko's percentage-change fields do not reconcile with its own price series, a discrepancy this desk has measured repeatedly. Every window in this piece is computed from daily closes with the anchor date printed: 20 August 2026 at $1.4512 for the 30-day figure, 12 September at $2.0106 for the week, 20 September 2025 at $5.1512 for the year. Different anchors produce different headlines from identical data.
Is Pendle's TVL number reliable?
DefiLlama's headline figure of $1.27bn excludes staked PENDLE and pool2, which are reported separately, so it is not inflated by the token's own price. It does include incentive-driven deposits on new chains that pay almost nothing in fees, which is why the chain-level fee breakdown matters more than the aggregate.
What does the buyback actually do to supply?
Pendle's documentation routes 80% of yield and swap fees to a contract that buys PENDLE on the open market over a week on a one-hourly TWAP, then distributes the purchased tokens to active stakers fortnightly. The tokens are not burned. They move from the float into staker hands, so the effect is on circulating supply and on staker yield rather than on total supply, which remains 281,527,448.
How much does the Robinhood Chain deployment matter financially?
Almost nothing yet. Robinhood Chain held $539,205 of Pendle deposits and produced $61 of protocol fees over thirty days to 19 September 2026. The strategic case for tokenised stock dividend markets is real and untested; the revenue case does not exist at this size, and pricing it as though it does is the specific error this rally has made.
What is Boros and why does it appear separately?
Boros is Pendle's funding-rate swap venue on Arbitrum, categorised by DefiLlama as interest-rate derivatives and reported as a linked protocol rather than inside Pendle V2. It ran $37,065 over thirty days against a $634,802 protocol-wide total, and $715,944 across the trailing year against $781,614 since launch, so more than nine tenths of its lifetime revenue has come in the last twelve months.
Where do the scenario levels come from?
Each is anchored to a multiple of trailing twelve-month holders' revenue of $14,220,108 on the 173,577,698 circulating supply: $4.10 is 50 times, $2.20 is 26.9 times and $1.55 is 18.9 times. Thirty-day realised volatility of 95.6% annualised means all three sit inside a single standard deviation over the 103 days to 31 December 2026.
Disclaimer
This article is analysis and information, not investment advice, and it is not a recommendation to take any position. Digital assets are volatile and capital is at risk. Figures are those retrieved from the named sources on 19 September 2026 and will have moved by the time you read this. The Traders Spread holds no position in PENDLE.