

Sandisk's non-GAAP gross margin reached 85.1% in the quarter ended 2 October 2026, 55.2 percentage points above the 29.9% the company reported for the quarter ended 3 October 2025.
Gross margin is the share of revenue left after the direct cost of the goods sold, gross profit divided by revenue. On the stockanalysis.com quote feed retrieved at 06:58 UTC on 30 October 2026, Sandisk (SNDK) was at $1,279.50 in after-hours trade at 7:59 pm EDT on 29 October, down $50.55, or 3.8%, from the $1,330.05 regular close at 4:00 pm EDT. The release went out after that close.
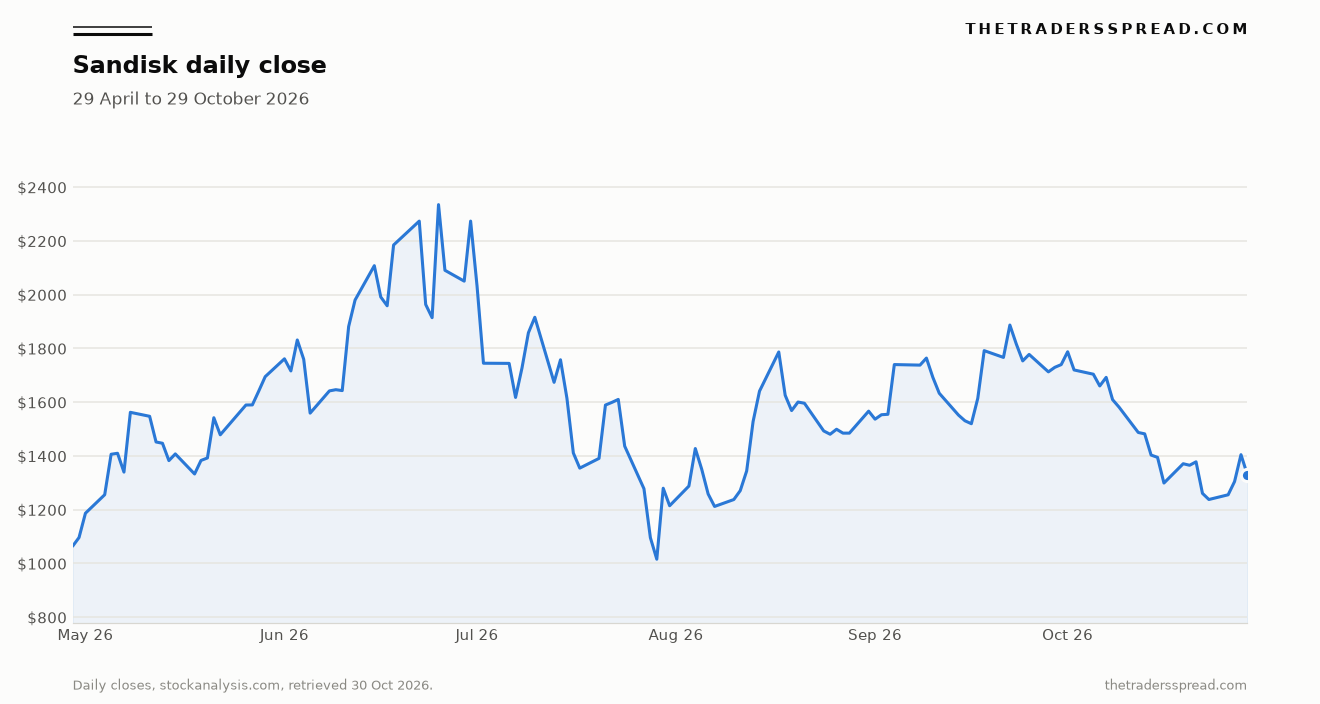
The figure that makes the decline easier to read is the shape of the next step, not the size of the last one. Management's second-quarter revenue range of $12.2 billion to $12.6 billion sits 10.6% to 14.2% above the $11.031 billion just booked, slower than the 23% sequential jump, and the non-GAAP gross-margin band of 84.5% to 85.5% sits across the 85.1% just printed. The regular session had already closed down 5.32% from $1,404.77, and that $1,330.05 close was 43.5% under the $2,354.39 high on the same feed's 52-week range. A profit this large can still meet a seller when the increment stops widening. The same pairing showed up when Jabil fell after a fiscal fourth-quarter beat.
Key figures
- Fiscal first-quarter revenue was $11.031 billion, up 23% from $8.965 billion in the prior quarter and up 378% from $2.308 billion a year earlier. Source: Sandisk Exhibit 99.1, filed 29 October 2026.
- Non-GAAP diluted earnings were $49.51 a share. GAAP diluted earnings were $52.60 a share, up from $0.75 a year earlier. Source: Sandisk Exhibit 99.1, filed 29 October 2026.
- Non-GAAP gross margin was 85.1%, against 84.6% in the prior quarter and 29.9% a year earlier. GAAP gross margin was 85.0%. Source: Sandisk Exhibit 99.1, filed 29 October 2026.
- Datacenter revenue was $4.802 billion, up 61% from $2.977 billion in the prior quarter. Edge revenue was $5.832 billion. Consumer revenue was $397 million. Source: Sandisk Exhibit 99.1, filed 29 October 2026.
- The board approved an eight-for-one forward stock split. Holders of record at the close on 9 November 2026 receive seven extra shares, issued after the close on 19 November 2026. Source: Sandisk Exhibit 99.1, filed 29 October 2026.
- After-hours trade was $1,279.50 at 7:59 pm EDT on 29 October 2026, 3.8% under the $1,330.05 regular close at 4:00 pm EDT. Source: stockanalysis.com quote feed, retrieved 30 October 2026.
- Second-quarter guidance is revenue of $12.2 billion to $12.6 billion and non-GAAP diluted earnings of $55.00 to $57.00 a share, both on a pre-split basis. Source: Sandisk Exhibit 99.1, filed 29 October 2026.
Follow the revenue, then the cash
A forward split issues extra shares so that each existing share becomes several, and the price of each share falls by the same factor. The pre-split share is the share as it exists before those extra shares are issued, and every per-share figure in the 29 October release is stated on that basis. The calendar of the split follows the revenue.
Revenue of $11.031 billion is the base every margin hangs on. Sales rose $2.066 billion from the quarter ended 3 July 2026, and from $2.308 billion in the quarter ended 3 October 2025. GAAP gross profit was $9.378 billion. The large move in the margin is the year-ago comparison, 29.8% GAAP and 29.9% non-GAAP, rather than the half-point sequential tick from 84.6%.
Datacenter sales did most of the sequential work. The $4.802 billion booked there was $1.825 billion above $2.977 billion, and that $1.825 billion is 88% of the $2.066 billion increase in total revenue. Edge, still the larger book, rose $400 million to $5.832 billion, up 7% sequentially and 320% from $1.387 billion a year earlier. Consumer fell from $556 million to $397 million, and from $652 million a year earlier. Datacenter is now 43.5% of sales, up from 33.2%, while Edge is 52.9% and consumer is 3.6%. Datacenter here is flash sold into servers. Edge is the broader device channel, and it is still bigger in dollars.
GAAP operating expenses were $598 million, up 10% from $545 million, and non-GAAP operating expenses were $513 million, up 6% from $484 million. Sales rose faster than either expense line. GAAP operating income was $8.780 billion, a 79.6% margin, and non-GAAP operating income was $8.871 billion, an 80.4% margin, against 7.6% and 10.6% a year earlier. GAAP diluted earnings were $52.60, up from $43.97 and from $0.75. Non-GAAP diluted earnings were $49.51, up from $39.25 and from $1.22. Diluted shares averaged 154 million, against 157 million and 149 million.
Here the adjusted earnings figure is the lower one. GAAP net income was $8.101 billion and non-GAAP net income was $7.624 billion. The bridge adds back $91 million of stock-based compensation and subtracts a $513 million gain on equity securities, with a small other item and a $58 million tax adjustment, to reach $7.624 billion. Sandisk describes that equity line as mark-to-market moves, sale gains and impairments, and leaves it out of the non-GAAP measures. Comparing $49.51 with $52.60 is mostly that gain being set aside. The line-by-line walk through a Lam Research report is a useful companion when the two columns are still new.
Operating cash flow was $6.363 billion, down from $7.126 billion and up from $488 million a year earlier. Net capital spending was $54 million, so free cash flow was $6.309 billion, against $7.083 billion and $438 million. As a share of revenue, operating cash flow fell to 57.7% from 79.5%, while the non-GAAP operating margin rose from 79.2% to 80.4%.
Adjusted free cash flow removes activity related to Flash Ventures and the cash effect of prepayments and deposits under agreements the filing calls New Business Models. This quarter those lines were $148 million and $465 million, so $6.309 billion of free cash flow becomes $5.696 billion adjusted. The prior quarter ran from $7.083 billion through $110 million and $1.938 billion to $5.035 billion. Adjusted dollars rose, while the margin on sales slipped from 56.2% to 51.6% because revenue grew faster than the adjusted cash.
Sandisk returned $5.0 billion by repurchasing approximately 3.2 million shares, and 6.0 million shares over two quarters, about 4% of shares outstanding. Divide $5.0 billion by 3.2 million and the average is about $1,560, only as sharp as the word "approximately." That average describes purchases in the quarter ended 2 October, not a purchase at the $1,279.50 after-hours print, and the 52-week high on this feed is $2,354.39. Cash ended at $5.136 billion, up from $4.762 billion at the start of the fiscal year.
David Goeckeler, chairman and chief executive of Sandisk, said in Exhibit 99.1 on 29 October 2026: "We are executing on the strategy that we outlined at Investor Day, delivering growing and durable free cash flow through our technology leadership, deep customer partnerships, and disciplined financial management." Free cash flow of $6.309 billion is large next to $438 million a year earlier and smaller than the prior quarter. The same filing notes Sandisk was wholly owned by Western Digital until the separation on 21 February 2025.
Eight shares where one stood
The board approved an eight-for-one forward split of the common stock through an amendment to the certificate of incorporation. Holders of record at the close on 9 November 2026 receive seven additional shares, issued after the close on 19 November. Trading on the new basis is expected from the open on 20 November. Sandisk says market value and each holder's ownership percentage stay as they were. The stated reason is access, including through the employee stock purchase plan.
Apply the ratio to the after-hours price and one pre-split share at $1,279.50 becomes eight shares at about $160, the same claim on the company. The $49.51 non-GAAP result would be about $6.19 on a post-split share, and the $55.00 to $57.00 guide about $6.88 to $7.13. Those amounts apply the ratio to figures the release states before the split. The buyback spends cash to retire shares. The split multiplies the count after 19 November.
On 29 October the share opened at $1,381.50, under the prior close, reached $1,385.80, and closed at $1,330.05 after a low of $1,321.99, on volume of 8,449,869 shares. The after-hours print of $1,279.50 sits under that low. From $1,404.77 to $1,279.50 is 8.9%, a window that mixes the regular session with the later reaction. The move from the pre-release close is the 3.8%.
Techmeme's headline that night bundled the revenue figure, the split and an after-hours drop it put above 4%, citing MarketWatch. The measured move on the quote feed used here is 3.8% from $1,330.05 to $1,279.50.
Sandisk reports Q1 revenue up 378% YoY to $11B, vs. $10.7B est., forecasts Q2 revenue above est., announces an 8-for-1 stock split; SNDK drops 4%+ after hours (MarketWatch)
— Techmeme (@Techmeme) October 29, 2026
(Visit Techmeme dot com for the link and full context!)
A drop before the numbers and a drop after them answer different questions. The session loss of 5.32% is the market's mood into the release. TSMC's decline ahead of its own earnings print is that earlier kind of window. Sandisk's after-hours trade is the later kind. Only the second window had the 85.1% margin, the $49.51 of non-GAAP earnings and the split in front of it.
| Measure | Q1 FY2027 | Prior quarter | Year-ago quarter |
|---|---|---|---|
| Revenue | $11,031 | $8,965 | $2,308 |
| GAAP gross margin | 85.0% | 84.6% | 29.8% |
| Non-GAAP gross margin | 85.1% | 84.6% | 29.9% |
| GAAP diluted EPS | $52.60 | $43.97 | $0.75 |
| Non-GAAP diluted EPS | $49.51 | $39.25 | $1.22 |
| Datacenter revenue | $4,802 | $2,977 | $269 |
| Edge revenue | $5,832 | $5,432 | $1,387 |
| Consumer revenue | $397 | $556 | $652 |
| Free cash flow | $6,309 | $7,083 | $438 |
| Adjusted free cash flow | $5,696 | $5,035 | $448 |
What this changes
The second-quarter outlook is what changes the reading of an enormous quarter. Revenue of $12.2 billion to $12.6 billion has a $12.4 billion midpoint, 12.4% above $11.031 billion, with the ends 10.6% and 14.2% above it. After a 23% sequential increase, the middle of the range is roughly half that pace. Non-GAAP gross margin of 84.5% to 85.5% contains the 85.1% just reported. GAAP gross margin is guided to 84.4% to 85.4%. The rate is expected to stay very high.
RelatedVertiv (VRT) shares rose 2.81% on the fluid-services close
GAAP operating expenses are guided to $677 million to $745 million, and non-GAAP expenses to $540 million to $560 million after excluding about $137 million to $185 million of stock-based pay. Non-GAAP diluted earnings of $55.00 to $57.00 sit 11.1% to 15.1% above $49.51. The outlook uses a 14.3% non-GAAP tax rate and 151 million diluted shares, three million under this quarter's 154 million.
| Measure | Q1 result | Q2 guide |
|---|---|---|
| Revenue | $11.031 billion | $12.2 billion to $12.6 billion |
| Non-GAAP gross margin | 85.1% | 84.5% to 85.5% |
| Non-GAAP operating expenses | $513 million | $540 million to $560 million |
| Non-GAAP diluted EPS | $49.51 | $55.00 to $57.00 |
| Diluted shares | 154 million | 151 million |
Datacenter, up 61% to 43.5% of sales, leaves the report more exposed to server demand than when that end market was $269 million. Edge, at $5.832 billion, is still the majority of revenue. Consumer is 3.6% of the total. Operating cash flow margin fell to 57.7% from 79.5%, and the $5.0 billion repurchase used most of the $6.363 billion of operating cash.
What would change the read
The read of this print is that the profit was exceptional and the share fell because the guided next step is slower and the margin band has stopped climbing. That reading would change if the next quarter produces revenue above $12.6 billion and a non-GAAP gross margin above 85.5%. A result inside the range, even at $57.00 of non-GAAP earnings, would leave the reading intact, because the guide already allows both.
The cash reading would change if adjusted free cash flow keeps rising from $5.696 billion while the New Business Model line stays near $465 million, rather than the prior quarter's $1.938 billion, and if operating cash flow margin moves back toward 79.5% from 57.7%. A second quarter of weaker conversion, with gross margin still near 85%, would mean the earnings rate and the cash rate had parted ways for longer than one swing in working capital. The end-market reading would change if datacenter stopped supplying most of the sequential dollar growth.
The split would change the reading only if, from the open on 20 November, each new share traded far from about one-eighth of the pre-split price. A clean rescaling would match the release on market value and ownership percentages. A post-ratio price far from the after-hours $1,279.50 would mean the market had revised the quarter in the three weeks before the new basis. Until then the comparison is the pre-split tape against the pre-split guide.
FAQ
What does Sandisk's 8-for-1 forward split change for a shareholder?
Each pre-split share becomes eight shares. Holders of record on 9 November 2026 receive seven extra shares after the close on 19 November, with trading on the new basis from 20 November. Market value and ownership percentages stay the same. The $49.51 result and the $55.00 to $57.00 guide are stated before the split, so dividing by eight only rescales them.
Why is GAAP earnings per share higher than the non-GAAP figure?
GAAP diluted earnings were $52.60 and the non-GAAP figure was $49.51. Sandisk removes items it treats as outside the core memory business, and the largest this quarter was a $513 million gain on equity securities. The bridge also adds back $91 million of stock-based pay and records a $58 million tax adjustment, so non-GAAP net income is $7.624 billion against GAAP net income of $8.101 billion. On that stripped basis, $49.51 compares with $39.25 in the prior quarter.
Which Sandisk price move is the reaction to the profit print?
The $1,330.05 close, down 5.32% from $1,404.77, printed at 4:00 pm EDT on 29 October, before the release. The reaction is the $1,279.50 after-hours trade at 7:59 pm EDT, down 3.8% from that close and under the $1,321.99 low. Only that later window follows the revenue, the 85.1% margin, the split and the guide. The feed was retrieved at 06:58 UTC on 30 October 2026, with Nasdaq still closed.
This is analysis, not a recommendation to buy or sell any security. Prices move, and capital is at risk. Figures come from Sandisk's Exhibit 99.1 filed with the SEC on 29 October 2026 and from the stockanalysis.com quote feed for SNDK retrieved on 30 October 2026.