

| State | Freight | Trade range | Average | Week change | Year ago |
|---|---|---|---|---|---|
| Illinois | FOB rail | 2.0900–2.1000 | 2.0950 | not printed | 1.7900 |
| Illinois | FOB truck | 2.1000 | 2.1000 | up 0.0500 | 1.8100 |
| Indiana | FOB rail | 2.1400–2.1700 | 2.1550 | not printed | 1.7200 |
| Iowa | FOB rail | 1.9600–1.9900 | 1.9750 | unchanged | not printed |
| Iowa | FOB truck | 1.9500–2.0500 | 2.0050 | unchanged | 1.7900 |
| Kansas | FOB truck | 1.9700–2.0300 | 1.9900 | unchanged | 1.7467 |
| Minnesota | FOB truck | 2.0400 | 2.0400 | unchanged | not printed |
| Nebraska | FOB rail | 2.0500 | 2.0500 | unchanged | not printed |
| Nebraska | FOB truck | 1.9800 | 1.9800 | unchanged | 1.6100 |
| South Dakota | FOB truck | 2.0300 | 2.0300 | unchanged | not printed |
Ethanol is carrying two facts that cannot both stay comfortable: the Iowa plant truck average is $2.005 a gallon, 21.5 cents above the $1.7900 year-ago figure on the same row of the USDA AMS National Weekly Ethanol Report for 12–16 October 2026, while EIA's Weekly Petroleum Status Report counted fuel-ethanol stocks at 24.6 million barrels for the week ending 16 October, 12.0 percent above the year-ago week. A higher plant price and a larger stockpile are a poor pair. One of them has to give way before 31 March 2027, or the tanks are holding a surplus the cash market has not marked down.
There is no national ethanol average on that sheet. The print used here is the Iowa truck FOB average, $2.0050, the row with a range, an average and a year-ago cell in the state that dominates fuel-alcohol grind. The range was $1.9500 to $2.0500. The change column said unchanged. Rows below the ethanol section, including distillers grains, are not gallon prices and are not averaged in.
The same EIA week contains a second split that a single stock headline will miss. Finished motor gasoline product supplied jumped to 8,982 thousand barrels a day from 8,408. Table 1 prints the difference as 575 thousand barrels a day, and as a gain of 529 thousand against the year-ago week of 8,454. Refiner and blender net inputs of fuel ethanol moved the other way, from 899 thousand barrels a day to 891. Inputs divided by gasoline supplied come to about 10.69 percent in the week of 9 October and about 9.91 percent in the week of 16 October. That ratio is a comparison of two opened series. It is not EIA's official blend rate. Gasoline demand bounced. The ethanol blenders took did not.
Into 31 March 2027 the base case on the Iowa truck average is $1.90. The bull case is $2.22. The bear case is $1.79. The lean is the base, under the $2.005 print, so the bias is bearish. Conviction stays low because the cash column has not broken. The stock figure is the risk, not a completed decline.
A plant tape that barely moved
The change column is almost empty. Iowa rail, Iowa truck, Kansas, Minnesota, Nebraska rail, Nebraska truck and South Dakota are unchanged. Indiana rail, the high average at $2.1550, has no change filled in. The only ethanol row that moved is Illinois truck, up 5 cents to $2.1000, against a year-ago average of $1.8100.
The averages are not one gallon. Indiana rail traded $2.1400 to $2.1700. Nebraska truck's year-ago cell of $1.6100 is the weakest year-ago print in the section. Iowa truck is the benchmark here because the row is complete.
Where a year-ago cell is printed, the current average is higher: Illinois rail $2.0950 against $1.7900, Kansas truck $1.9900 against $1.7467, Indiana rail $2.1550 against $1.7200. The top trade, $2.1700, is 16.5 cents over the Iowa truck average. The bottom of the Iowa range, $1.9500, is 5.5 cents under it. The week is tight. The year is not.
Same week, more output and more stocks
EIA's production page, released 21 October 2026, puts the week of 16 October at 1,094 thousand barrels a day, up from 1,065. Midwest PADD 2 made 1,033 of that, up 23 thousand barrels a day. The coasts were the rest: East Coast 14, Gulf Coast 27, Rockies 11, West Coast 9. The earlier weeks are in the table.
| Week | Production | Midwest production | Blender inputs | Exports | Stocks | Gasoline supplied |
|---|---|---|---|---|---|---|
| 11 Sep | 1,099 | 1,040 | 911 | 161 | 25,220 | 8,798 |
| 18 Sep | 1,028 | 962 | 907 | 122 | 24,683 | 8,847 |
| 25 Sep | 1,007 | 948 | 914 | 142 | 23,865 | 8,689 |
| 2 Oct | 1,053 | 1,010 | 897 | 166 | 23,743 | 8,769 |
| 9 Oct | 1,065 | 1,010 | 899 | 121 | 23,942 | 8,408 |
| 16 Oct | 1,094 | 1,033 | 891 | 132 | 24,558 | 8,982 |
Stocks fell from 25,220 thousand barrels on 11 September to 23,743 on 2 October, then turned. The week of 16 October added 616 thousand barrels, to 24,558. Table 1 rounds that to 24.6 million, against 23.9 a week earlier and 21.9 a year earlier, and prints the year-ago change as 2.6 million barrels and 12.0 percent. PADD 2 rose from 9,196 thousand barrels to 9,652. That 456 thousand is about three quarters of the national build.
Table 1 also shows production of 1,094 thousand barrels a day running 18 thousand below the year-ago week of 1,112. The four-week average was 1,055 against 1,063, a printed minus 0.8 percent. Stocks are 12 percent above last year in a week the run rate did not beat last year.
Exports were 132 thousand barrels a day, up from 121 the week before and down from 166 two weeks before. Production of 1,094 minus blender inputs of 891 minus those exports is 71 thousand barrels a day. Seven times 71 is 497 thousand barrels, short of the 616 thousand barrel build. A rate times seven is not an inventory identity. Imports were not on the exports page.
The Renewable Fuels Association posted its read on 21 October 2026, rounding production and stocks to a 3 percent rise, gasoline demand to 7 percent, and ethanol usage to a 1 percent slip. The opened pages show 1,065 to 1,094, stocks 23,942 to 24,558, gasoline 8,408 to 8,982, and inputs 899 to 891. Near those whole numbers. Not the same as them.
Per @EIAgov: For the week ending 10/16, both #ethanol production and stocks expanded 3%. Implied gasoline demand leapt 7% and ethanol usage slipped 1%. Exports increased and no imports occurred. pic.twitter.com/t0QWRgIRpJ
— Renewable Fuels Association (@EthanolRFA) October 21, 2026
Corn eased, and the grind did not
The weekly file stamps futures as of 15 October 2026: December corn 478.00 cents, March 2027 corn 491.00, November natural gas $3.2360 per million Btu, November RBOB $3.1802, March 2027 RBOB $2.9583. AMS 3617, dated 21 October, stamps 20 October at December corn 462.00, March 2027 corn 476.00, November gas $2.9630, November RBOB $3.1172, March 2027 RBOB $2.9492. Corn, gas and gasoline cheapened. The daily PDF is a corn-bid sheet and does not reprint plant ethanol, so the gallon price stays the 16 October average.
Delivered corn on 21 October was lower on the week and still above last year. Iowa East averaged $4.2977 a bushel, off 5 cents, against $3.8921 a year earlier. Iowa West was $4.3082, also off 5 cents, against $3.8449. Eastern Iowa corn is still about 41 cents a bushel over its year-ago row. The drop from 478 cents to 462 helps the crush versus mid-October. It does not rewind the year.
November gas fell from $3.2360 to $2.9630, and March 2027 gas from $2.7360 to $2.6170. Cheaper gas and corn make the next barrel easier to produce. They do not lift the ethanol price by themselves. Our corn price prediction and our natural gas price prediction are separate calls. Here they are the cost side only.
USDA's National Agricultural Statistics Service, in Grain Crushings released 1 October 2026, put August corn for fuel alcohol at 478 million bushels. The cell is 477,732 thousand, up less than 1 percent from July's 476,146 thousand and up 4 percent from 459,373 thousand in August 2025. Dry mills took 440,666 thousand, 92.2 percent. Wet mills took 37,066 thousand, 7.8 percent. Distillers dried grains were 1,845,438 tons. Julie Weber, section chief in the NASS Estimation Branch, is the listed contact. The figures are the Agricultural Statistics Board's.
Geoff Cooper, president and chief executive of the Renewable Fuels Association, was speaking in Orlando on 25 February 2026, not about this week. "We saw glimpses of our industry's potential last year, and 2025 was another good year for the U.S. ethanol industry," he said. "But we could have done so much more, if simply given the opportunity." The release of those remarks puts 2025 production at 16.4 billion gallons, domestic use at 14.3 billion and exports at 2.2 billion. His constraint was access, year-round E15, not a shortage of gallons.
He also called ethanol "a broadly available, low-cost, low-carbon, and scalable alternative fuel" for ships and aircraft. Low-cost is the producer's wish. On the Iowa truck files opened for the chart, the latest average is the highest sample since October 2024.
Chicago ethanol futures are not this print
Chicago ethanol futures hedge the Chicago market, not one state's truck bid. CME Group's daily energy bulletin did not load. No Chicago settlement is in the title or the chart, and none was borrowed from a search snippet or from RBOB.
On 20 October, November RBOB settled at $3.1172 and March 2027 RBOB at $2.9492. April 2027 was $3.1624. March is the soft point. A call that ends on 31 March 2027 ends on that cheap contract.
November RBOB at $3.1172 minus the Iowa truck average of $2.0050 is about $1.11. That is not a blend margin: a New York harbor gasoline future against an Iowa plant-gate truck. Ethanol is still the cheap gallon on the arithmetic, which makes the drop in blender inputs the odd print. Our note on US gasoline and Midwest refinery runs uses a different gasoline series. It is context, not these settlements.
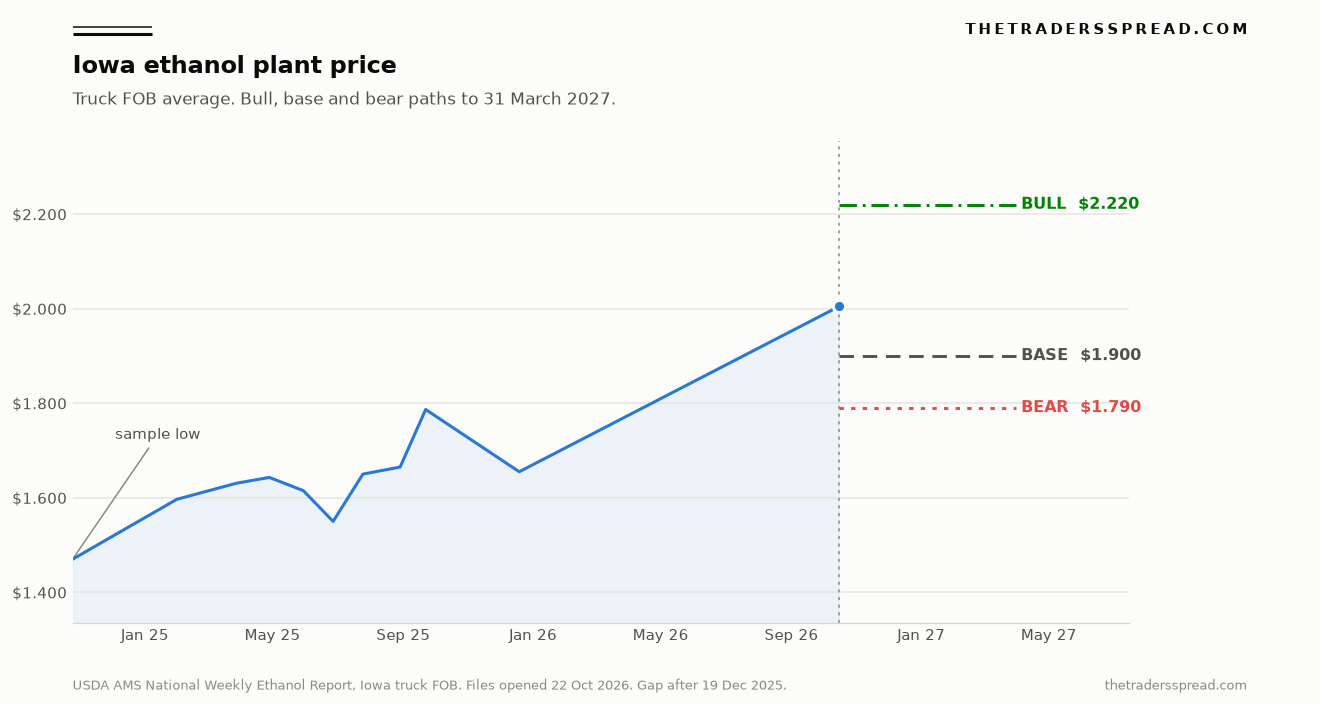
The chart plots Iowa truck FOB averages from files opened for this piece. The sample runs from $1.4700 on 25 October 2024 to $2.0050 on 16 October 2026, with $1.5500 on 27 June 2025, $1.7867 on 22 September 2025 and $1.6550 on 19 December 2025 among the turns. The December 2025 file is the AMS PDF captured on 5 January 2026, because the live address serves only the current week. The line after that date is a gap, not a measured rally. Inside the opened points, $2.005 is the high.
Three numbers to 31 March 2027
$2.22 applies the Iowa truck row's own gain a second time. $2.0050 minus $1.7900 is 21.5 cents, and $2.0050 plus 21.5 cents is $2.220. The USDA file does not call that a forecast. It clears the live print by about 11 percent, which is what a bull case in the title has to do.
RelatedGermanium Price Prediction: 33,000 Yuan Bull vs 24,000 Bear
Getting there by March means stocks stop building while blender inputs, last at 891 thousand barrels a day, move back through 900 and stay there. Exports would need to look more like the 166 of 2 October than the 121 of 9 October. Illinois truck's 5 cent rise would have to show up in Iowa. One state paying up does not reprice the benchmark.
Year-round E15 would lift inputs without a larger gasoline market. Cooper's February release still described that legislation as unfinished. The $2.22 case assumes the stock and blend math, not the statute.
$1.90 is 10.5 cents under the live average and under this week's Iowa truck low of $1.95. It stays above the year-ago $1.7900 and the December 2025 sample of $1.6550. That is a partial giveback, not a return to the October 2024 low of $1.4700. March RBOB at $2.9492 and stocks 12 percent above last year are enough to take the average off the top of this sample. They are not a case for erasing the whole year-over-year gain.
$1.79 is the year-ago Iowa truck average, used as a destination below the live print. Reaching it means production holds near the four-week average of 1,055 thousand barrels a day, inputs stay at or under 891, and exports do not clear the residual. Corn can keep easing, as it did from 478 cents to 462, without cutting the grind. August fuel use of corn was already 4 percent above the prior August. Cheaper feedstock that does not cut runs presses the ethanol price. The bear case needs Iowa back at Iowa's own year-ago print.
A trade above $2.18 retires that base. The highest ethanol sale on the 16 October sheet is $2.1700, the top of the Indiana rail range. Through $2.18 the complex would have cleared every trade on the sheet. The entry is $2.005. The target on the bearish bias is the base, $1.90, not the $1.79 stress case. Conviction is 2 out of 5 because the cash column still says unchanged.
From $1.6550 in December 2025 to $2.0050 in October 2026 is 35 cents across weeks this page does not have. Treating the chart gap as a trend invents those weeks. Which file shows up first: blender inputs back above 900 thousand barrels a day with stocks no longer building, which is what $2.22 needs, or an Iowa truck trade under $1.95 while March RBOB is still the soft contract, which turns $1.90 from a base into a stop on the way toward $1.79?
Questions the weekly files can answer
What ethanol plant price is this prediction using?
The price is the Iowa truck FOB average of $2.0050 a gallon from the USDA AMS National Weekly Ethanol Report dated 16 October 2026, covering trades for 12–16 October. The range was $1.9500 to $2.0500, unchanged, against a year-ago average of $1.7900. The report prints state rows, not one U.S. plant price. Iowa truck is the row used here because it carries a range, an average and a year-ago figure.
Where do Chicago ethanol futures fit if no settlement was read?
Chicago ethanol futures are the exchange hedge for the Chicago market, and they are not the number in this prediction. The CME daily energy bulletin did not load, so no futures settlement was taken from a search snippet or from a renamed RBOB line. The gasoline figures that do appear are NYMEX RBOB settlements printed inside the USDA AMS reports, as of 15 October and 20 October 2026. They are a different commodity.
Why did stocks rise in a week when gasoline demand jumped?
Production rose to 1,094 thousand barrels a day while refiner and blender net inputs fell to 891 thousand and exports were 132 thousand. Gasoline product supplied rose to 8,982 thousand barrels a day. The ethanol blenders took did not rise with it. Stocks increased by 616 thousand barrels, to 24,558, and 456 thousand of that build was in the Midwest. A higher gasoline number was not, this week, a higher ethanol bid.
How does the corn price sit next to the ethanol plant price?
December corn settled at 478.00 cents on 15 October in the weekly ethanol report and at 462.00 cents on 20 October in the daily report. Iowa East delivered corn averaged $4.2977 a bushel on 21 October, down 5 cents and about 41 cents above that row's year-ago average. Ethanol's Iowa truck price is 21.5 cents above its own year-ago cell. Feedstock is cheaper than a week ago and still dearer than a year ago.
What would the $2.22 bull case need by March 2027?
$2.22 is the Iowa truck average plus the 21.5 cent gain versus the year-ago cell on the same row. It would need stocks to stop building, blender inputs back above 900 thousand barrels a day, and the plant tape rising in more states than Illinois. A finished year-round E15 law could change the blend math. The February 2026 RFA account still described that law as unfinished, so the bull case cannot treat it as done.