

Regeneron led its 30 October release with the line that third-quarter 2026 revenues increased 36% to $5.1 billion versus the third quarter of 2025. That sentence is the first bullet of Exhibit 99.1 to Form 8-K, accession 0000872589-26-000032, filed the same morning. The income statement turns the rounded $5.1 billion into $5,115.8 million. The Nasdaq close answered the question of attention before the footnotes did. REGN finished at $927.89, up $109.12 from the 29 October close of $818.77.
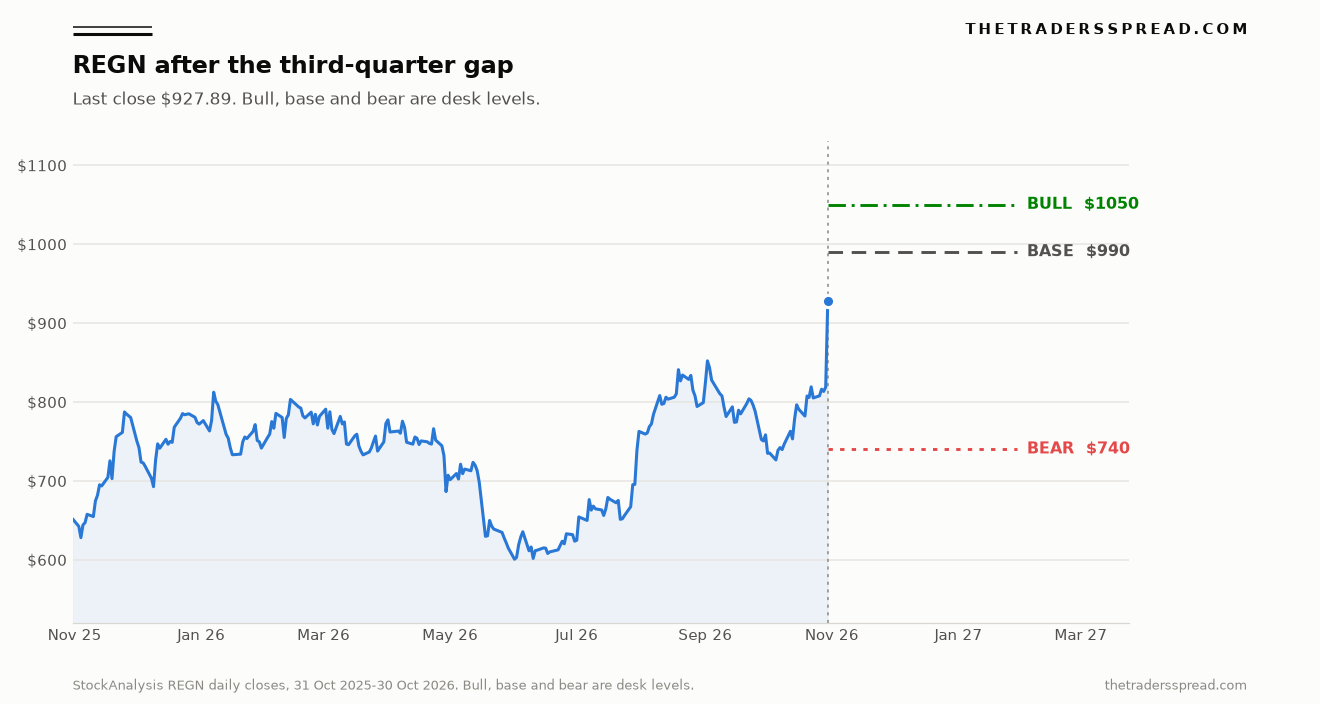
That close is the print under this map. The StockAnalysis quote feed stamped the regular-session price at 4:00 p.m. EDT on 30 October, and we retrieved it at 07:57 UTC on 31 October, with the session already marked closed. After-hours trading on the same feed was $929.50 at 7:57 p.m. EDT, 0.17% above the official close. A second move of the same 13.33% lands at $1,051.55, and we round the bull path to $1,050. The bear path is $740, rounded from a 200-session average of $737.54. The base we store between them is $990, and both outer levels sit on the correct side of $927.89.
The tension worth keeping sits inside the revenue line, and it is easy to lose if the travelling number is the 70% rise in non-GAAP earnings per share. Sanofi collaboration revenue was $2,724.0 million of the $5,115.8 million total, about 53%. Net product sales were $1,805.3 million, about 35%. Regeneron's share of profits on the Sanofi antibody collaboration rose by $1,119.4 million, from $1,455.5 million to $2,574.9 million, and that increase is about 82% of the $1,361.5 million rise in total revenue. Dupixent, which Sanofi records, grew 35% to $6,540.5 million worldwide. Combined U.S. EYLEA HD and EYLEA net sales, which Regeneron records, were $1,098.5 million against $1,111.2 million a year earlier. The 13.33% session priced a collaboration quarter in which EYLEA HD's record mostly replaced EYLEA.
Key figures on the pages we opened
- Third-quarter revenue was $5,115.8 million, up from $3,754.3 million, and GAAP diluted earnings per share were $18.45, up from $13.62. Source: Regeneron Exhibit 99.1, income statement, filed 30 October 2026.
- Non-GAAP diluted earnings per share were $20.07, up from $11.83, on non-GAAP net income of $2,150.0 million against $1,287.2 million. Source: Exhibit 99.1 reconciliation, 30 October 2026.
- Dupixent global net sales, recorded by Sanofi, were $6,540.5 million, up 35%. U.S. EYLEA HD net sales were $698.8 million, up 62%. Global Libtayo net sales were $550.0 million, up 51%. Source: Exhibit 99.1, Table 5, 30 October 2026.
- Combined U.S. EYLEA HD and EYLEA net sales were $1,098.5 million, down from $1,111.2 million, and the global pair was $1,741.2 million, down 11%. Source: Exhibit 99.1, Table 5, 30 October 2026.
- REGN closed at $927.89 on 30 October 2026, up $109.12 or 13.33% from $818.77, in a range of $839.08 to $935.35. Source: StockAnalysis quote, 4:00 p.m. EDT stamp, retrieved 31 October 2026 at 07:57 UTC.
- Cash and marketable securities were $18,858.5 million at 30 September 2026, against $18,865.8 million at 31 December 2025, after $2.3 billion of repurchases and with $2.2 billion of authority left. Source: Exhibit 99.1, Table 1, 30 October 2026.
1. What the 30 October tape actually did
The open was already a gap. REGN printed $869.43, $50.66 and 6.19% above the prior close. The low was $839.08, still $20.31 above $818.77, so the whole regular-session range sat above the price of the eight sessions before the print. The high was $935.35, 14.24% above the prior close, and the close came back $7.46 from that high, about 0.80%, on volume of 2,851,707 shares.
Regeneron's own account posted the headline figure the same morning, and the wording matches the 8-K: third-quarter revenue of $5.1 billion, up 36% from the year-ago quarter.
Regeneron third quarter 2026 financial results: total revenues of $5.1B up 36% vs. Q3 2025. Full release: https://t.co/F7gQOUaBfB pic.twitter.com/bKJr32qsxF
— Regeneron (@Regeneron) October 30, 2026
The history file from the same vendor holds 251 daily closes from 31 October 2025 through 30 October 2026, starting at $651.80. The lowest close is $600.66 on 1 June 2026, and the last close under $700 was $695.42 on 29 July. The highest close before the earnings session was $852.03 on 2 September, the only close at or above $850 until 30 October, with the stock back at $758.27 by 30 September. From 20 October through 29 October every close sat between $805.02 and $819.09, and the next session added $109.12. The quote's 52-week low is $591.52.
The close is stretched against averages of that file. The last 20 closes average $788.89, leaving $927.89 some 17.62% above the short average. The last 50 average $793.30, and the close is 16.97% above that. The last 200 average $737.54, and the close is 25.81% above the long average. From the 31 December 2025 close of $771.87 the share is up 20.21%, and from the 1 June low close it is up 54.48%. On this desk, Jabil fell after a fiscal fourth-quarter beat, a reminder that print quality and the next price are separate facts.
2. Five lines that add up to $5.116 billion
The highlights round total revenue to $5,116 million, up 36% from $3,754 million. The income statement splits a slightly tighter total into three families: net product sales of $1,805.3 million, up from $1,587.7 million; collaboration revenue of $3,000.5 million, up from $1,968.4 million; and other revenue of $310.0 million, up from $198.2 million. Collaboration is 58.7% of the quarter. Sales Regeneron records on its own label are the minority of the top line.
Sanofi collaboration revenue was $2,724.0 million, up 68% from $1,617.0 million. Bayer was $266.8 million, down from $344.8 million. Of the Sanofi line, $2,574.9 million was antibody profit share and $149.1 million was supply reimbursement, against $161.5 million a year earlier. Christopher Fenimore, executive vice president, finance and chief financial officer of Regeneron, tied the 36% revenue increase and the 70% non-GAAP earnings-per-share increase to commercial execution and to the Sanofi step-up after the Development Balance was repaid at the end of the second quarter. The gap leaves the mix the buyer paid for still unresolved.
| Line, $ millions | Q3 2026 | Q3 2025 | Change |
|---|---|---|---|
| Net product sales | 1,805.3 | 1,587.7 | +14% |
| Sanofi collaboration | 2,724.0 | 1,617.0 | +68% |
| Bayer collaboration | 266.8 | 344.8 | down 23% |
| Other collaboration | 9.7 | 6.6 | +47% |
| Other revenue | 310.0 | 198.2 | +56% |
| Total revenue | 5,115.8 | 3,754.3 | +36% |
3. Dupixent grew, and the retina franchise swapped vials
Leonard Schleifer, board co-chair, president and chief executive of Regeneron, said it was an outstanding quarter, with Dupixent, EYLEA HD and Libtayo each at record net sales. Dupixent global net sales were $6,540.5 million, against $4,857.0 million. The United States was $5,064.1 million of that, about 77%, and the rest of the world was $1,476.4 million. Sanofi records the sales and Regeneron records the profit share, so a $6.5 billion product can sit beside a $5.1 billion company total because the two figures measure different things. Nine-month Dupixent sales of $17,418.8 million, also up 35%, make the quarter look like the prescription run-rate.
EYLEA HD global sales were $1,082.8 million, up 63% from $663.0 million, including $698.8 million in the United States, up from $430.6 million, and $384.0 million recorded by Bayer outside the United States, up from $232.4 million. Older EYLEA went the other way. Global EYLEA sales were $658.4 million, down 49% from $1,302.0 million, and the U.S. figure was $399.7 million, down from $680.6 million. The company ties the U.S. decline to competitive pressure and to patients moving to EYLEA HD, and it ties the EYLEA HD increase to volume, partly offset by a lower net selling price. A lower net price on a growing biologic is the same family of question we looked at in Novo Nordisk's list price versus the net sales it reports.
Add the two retinal products and the record loses its shine. Combined global sales were $1,741.2 million, down 11% from $1,965.0 million. Combined U.S. sales fell $12.7 million, because EYLEA HD added $268.2 million and EYLEA gave up $280.9 million. EYLEA HD is about 64% of that U.S. pair, and Bayer collaboration revenue fell $78.0 million. Libtayo was the cleaner win on Regeneron's own label: $550.0 million global, up 51%, of which the United States was $395.8 million, up 81%. Kevzara, recorded by Sanofi, was $255.6 million, up 66%.
| Product, global net sales, $ millions | Q3 2026 | Q3 2025 | Change |
|---|---|---|---|
| Dupixent, recorded by Sanofi | 6,540.5 | 4,857.0 | +35% |
| EYLEA HD | 1,082.8 | 663.0 | +63% |
| EYLEA | 658.4 | 1,302.0 | down 49% |
| EYLEA HD and EYLEA combined | 1,741.2 | 1,965.0 | down 11% |
| Libtayo | 550.0 | 365.2 | +51% |
| Kevzara, recorded by Sanofi | 255.6 | 154.0 | +66% |
4. Why 70% and 35% describe the same quarter
GAAP net income was $1,948.7 million, up from $1,460.0 million, and diluted GAAP earnings per share were $18.45 against $13.62, the increase the company calls 35%. Non-GAAP net income was $2,150.0 million against $1,287.2 million, and non-GAAP diluted earnings per share were $20.07 against $11.83, called 70% in the exhibit. Last year's quarter included $577.7 million of securities gains, which the reconciliation strips out, so 2025 non-GAAP net income sat below GAAP. This year's securities gain was $60.3 million, so non-GAAP net income sits above GAAP. That base effect is how 70% and 35% come off one quarter. Operating income was $2,048.2 million, up from $1,026.8 million, while other income fell to $235.9 million from $736.5 million.
Share counts differ, which is why one diluted figure misses the penny. GAAP diluted shares were 105.6 million, and non-GAAP diluted shares were 107.1 million. Divide $2,150.0 million by 107.1 million and the result is $20.07. Divide $1,948.7 million by 105.6 million and the result is $18.45. Research and development rose with the pipeline, to $1,794.7 million GAAP, up 22%, and $1,653.8 million non-GAAP, up 23%. Non-GAAP SG&A was $588.3 million, up 9%, and gross margin on net product sales held at 82% GAAP and 86% non-GAAP.
5. Cash sat still while the share count fell
Cash and marketable securities were $18,858.5 million on 30 September, against $18,865.8 million on 31 December 2025. Accounts receivable rose by $1,837.5 million, to $7,578.6 million. Nine-month operating cash flow was $3,675.3 million, capital expenditure was $771.0 million, and free cash flow was $2,904.3 million against $3,158.5 million. Repurchases over those nine months were $2.3 billion. The October dividend is $0.94 a share on the common and Class A stock, payable on 3 December 2026 to holders of record on 20 November, about 0.10% of the $927.89 close.
The spending guide moved at the edges. Non-GAAP research and development is now $6.050 billion to $6.150 billion, $100 million higher at each end than the prior range, and non-GAAP SG&A is $2.400 billion to $2.500 billion, $100 million lower. Gross-margin guidance is about 80% GAAP and about 86% non-GAAP, matching a quarter that already printed 82% and 86%. Regeneron also received a $1.0 billion Sanofi upfront for four long-acting antibodies, with up to $7.0 billion of further milestones and an equal split of future costs and profits. The exhibit times that upfront to fourth-quarter collaboration revenue. Against this quarter, $1 billion is about 19.5% of one quarter, arriving once. The printed guide covers spending, margins and tax, and leaves revenue and earnings-per-share ranges outside the table.
RelatedNovo Nordisk (NVO) List Price vs Reported Net Sales
6. $1,050, $990 and $740 from this close
We keep the bias at neutral and the conviction at 3, on a three-month window. The central level stored with that stance is $990. The bull level is $1,050 and the downside level that ends the map is $740, both measured from the $927.89 regular-session close. The same frame is how we have laid out other large healthcare names, including the Johnson & Johnson forecast on this desk.
The bull path repeats the earnings session in percentage terms. From $818.77 to $927.89 was 13.33%, and applying that ratio again produces $1,051.55, which we round to $1,050. That is 13.16% above the close and about $115 above the $935.35 intraday high. It needs Dupixent's 35% growth to remain the main fact, the upfront to be read as one quarter of collaboration revenue, and combined U.S. retina sales to stop shrinking. The stock is already up 54% from the June low, so a further 13% is a smaller leg that still starts 26% above the long average.
The base at $990 is 6.69% above the close and above the intraday high. It assumes the gap holds, the 2 September close of $852.03 stays behind the price, and the share stalls short of a second 13% leg, which fits a step-up that mixed Dupixent growth with a Development Balance that stays repaid. The bear path at $740 rounds the long average of $737.54 up by $2.46 and sits 20.25% under the close. The route back runs through $818.77 and the $805 to $819 cluster, if Friday paid a full price for a step-up that includes a retired accounting drag while EYLEA HD keeps offsetting EYLEA. The June close of $600.66 is under $740, so the bear level is inside the last year of closes.
| Path | Level | Versus the $927.89 close | Condition that fits the level |
|---|---|---|---|
| Bull | $1,050 | +13.16%, or $122 | A second earnings-day percentage move, rounded, clearing $935.35 |
| Base | $990 | +6.69%, or $62 | The gap holds above the $852.03 September close and stalls short of a full second leg |
| Bear | $740 | down 20.25%, or $188 | Price returns to the $737.54 long average, through the pre-gap shelf near $819 |
7. The question the next print has to settle
The pipeline is the part of the bull path that sits outside this quarter's profit share. The exhibit puts about 50 product candidates in the clinic, and Schleifer said an FDA decision on cemdisiran in generalized myasthenia gravis is expected next month, with Phase 3 work still running in oncology, anticoagulation and obesity. Pasatru, garetosmab, was approved in August for fibrodysplasia ossificans progressiva.
The chart carries $1,050, $990 and $740 out to 29 January 2027. The fourth-quarter report is where the $1 billion upfront lands in collaboration revenue, and where the U.S. retina pair either stays near $1.10 billion or starts to grow together. Dupixent's nine-month sales of $17.4 billion, up 35%, have to keep doing that work if the gap is going to stay open above $852.
Can Dupixent's 35% growth, on a $6.54 billion quarter Sanofi records as its own sales, carry a share price that has already paid 13.33% in one session for a profit step-up the Development Balance will contribute only once?
Figures come from Regeneron's Exhibit 99.1 to the Form 8-K filed on 30 October 2026 and from the REGN quote and daily-close history retrieved from StockAnalysis on 31 October 2026. The $1,050, $990 and $740 levels are a desk map of that print. They are not a recommendation to buy or sell any security.