

Is the market pricing BlackRock (BLK) on the $205 billion of net inflows it took in during the third quarter, or on the $60.1 billion that market moves took off assets under management in the same three months? The firm answered the first half on 14 October 2026. It reported $15.488 trillion of assets at 30 September and adjusted diluted earnings of $15.93 a share. The share has started on the second half. From the 13 October close of $1,066.12, BLK finished 16 October at $1,134.38, a rise of 6.4% in three sessions, with daily volume near 1.1 million shares. Ending AUM rose only $143.6 billion. Clients added money. Markets, above all in fixed income, subtracted it. The fee line still grew. That split, not the round number in the first bullet, is what the close is trading.
The awkward arithmetic sits in BlackRock's own bridge, in the 14 October earnings release, not in a broker summary. Private markets were 2% of AUM and 11% of base fees and securities-lending revenue. Institutional index accounts were 25% of AUM and 5% of that fee pool, and they produced a $27.4 billion outflow. Fixed-income AUM fell even as clients added $78.2 billion, because the market change on that book was negative $117.4 billion. The same release that shows 11% annualised organic base-fee growth also shows a GAAP operating margin stuck at 30.0%, unchanged from a year earlier. The adjusted margin the company prefers printed 47.8%.
Key facts
- BLK closed at $1,134.38 on 16 October 2026, up 6.4% from the 13 October close of $1,066.12 — stockanalysis.com daily history, retrieved 19 October 2026
- AUM was $15.488 trillion at 30 September 2026, against $15.345 trillion at 30 June — BlackRock Q3 2026 earnings release, 14 October 2026
- Net inflows were $205 billion in the quarter and $869 billion over the twelve months to 30 September, with 10% organic base-fee growth over that year — BlackRock earnings release, 14 October 2026
- Adjusted diluted EPS was $15.93, up 38% from $11.55; GAAP diluted EPS was $10.57, up 25% from $8.43 — BlackRock earnings release, 14 October 2026
- GAAP operating margin was 30.0%, flat on the year-earlier quarter; as-adjusted operating margin was 47.8%, up from 44.6% — BlackRock earnings release, 14 October 2026
- The firm repurchased $550 million of shares in the quarter and paid a cash dividend of $5.73 a share, against $5.21 a year earlier — BlackRock earnings release, 14 October 2026
- Technology services and subscription revenue was $588 million, up $73 million from a year earlier, and annual contract value rose 12% — BlackRock earnings release, 14 October 2026
Markets subtracted $60.1 billion
The bridge starts at 30 June on $15.345 trillion. Add $205.5 billion of net inflows, subtract $6.0 billion of realisations, apply a market change of negative $60.1 billion and a foreign-exchange gain of $4.3 billion, and 30 September is $15.488 trillion. Average AUM was $15.460 trillion, 19% above a year earlier. Fees bill off the average. Ending AUM rose by less than the inflow, because markets were a drag in the quarter itself.
Equity and fixed income moved in opposite directions. Equity AUM ended at $8.984 trillion, with $52.4 billion of net inflows and a positive market change of $40.1 billion. Fixed income ended at $3.353 trillion, down from $3.390 trillion, despite $78.2 billion of net inflows. The market change on that book was negative $117.4 billion. A mark-to-market on bonds can swamp a quarter of new subscriptions. The adjacent read is the US 10-year yield: when the existing stock of bonds reprices, AUM moves before any client does.
Cash took in $30.7 billion and finished at $1.101 trillion. Digital-asset AUM rose from $48.8 billion to $79.6 billion, mostly on a $22.9 billion market change. It is 1% of assets and 1% of base fees.
Long-term flows of $175 billion split as $125 billion in the Americas, $31 billion in EMEA and $19 billion in Asia-Pacific. Year to date, Asia-Pacific is only $10 billion, so the first half there was an outflow. The quarter reversed one region. It did not move the centre of the book.
Where the fee is actually earned
Base fees and securities-lending revenue were $6.036 billion, up $990 million from the third quarter of 2025. The release says organic base-fee growth and market beta on average AUM did the work. Securities lending was $253 million, up from $203 million, on higher spreads and a higher balance on loan. Total revenue was $7.752 billion, up 19% from $6.509 billion. Performance fees were $630 million of that, and they should not be annualised.
The release says why. Performance fees rose $114 million from a year earlier, "primarily reflecting higher revenue from liquid alternative products, largely related to a single hedge fund with an annual performance measurement period that ends in the third quarter," partly offset by lower private-markets performance fees. Liquid alternatives contributed $409 million. Private markets contributed $191 million, down from $298 million. A September measurement date is a calendar item. Next year's third quarter has to earn it again. Base fees do not reset that way.
The fee pool's mix is what an AUM headline cannot show. Shares and flows below are the release's own figures at 30 September 2026.
| Book | Share of AUM | Share of base fees and securities lending | Q3 net flows |
|---|---|---|---|
| Equity | 57% | 51% | $52.4 billion |
| Fixed income | 22% | 18% | $78.2 billion |
| Private markets | 2% | 11% | $15.3 billion |
| ETFs, by client type | 41% | 46% | $134.5 billion |
| Active, by style | 24% | 42% | $66.4 billion |
| Institutional index | 25% | 5% | outflow of $27.4 billion |
Private markets held $336.0 billion. That is the 2% and the 11%. ETFs held $6.358 trillion and produced $2.762 billion of the fee pool. Active strategies, by investment style, held $3.672 trillion, took in $66.4 billion, and accounted for 42% of base fees from 24% of assets. Institutional index held $3.933 trillion, produced $293 million of fees, and saw $27.4 billion leave. Non-ETF index as a style had a $26.1 billion outflow. The low-fee stock of assets and the low-fee flow are not the same fact.
Laurence D. Fink, Chairman and CEO, wrote in the release that clients "entrusted us with $205 billion of net inflows this quarter, and $869 billion over the last year." He also said inflows ran "across every asset class, client type, region, and across active and index," and that iShares generated $135 billion. The table's ETF line is $134.5 billion. The round number and the precise one are the same fact. "Across index" is true of iShares. It is not true of the institutional index book that lost $27.4 billion.
Systematic active equity had 92% of AUM above benchmark or peer median over one year, and 95% over five, on the release's preliminary page. Taxable active fixed income was 71% over one year and 84% over five. The page warns that past performance is not a guide. It still explains how those books could take inflows while bond marks were negative.
Inside ETFs, core equity took only $3 billion in the quarter, against $120 billion over nine months. Fixed-income ETFs took $61 billion. "Precision & other" took $41 billion of its $94 billion year-to-date total in this quarter alone. iShares' nine-month total is $444 billion. The quarter was not another wave of core equity beta.
Private-markets AUM rose only from $329.1 billion to $336.0 billion. Inflows of $15.3 billion were largely offset by $5.4 billion of realisations and a $2.9 billion market decline. Fink said twelve-month private-markets fundraising was $68 billion, and that the AI Infrastructure Partnership made its first deployment. The stock of assets barely moved. The 11% fee share is the point.
The path after 14 October
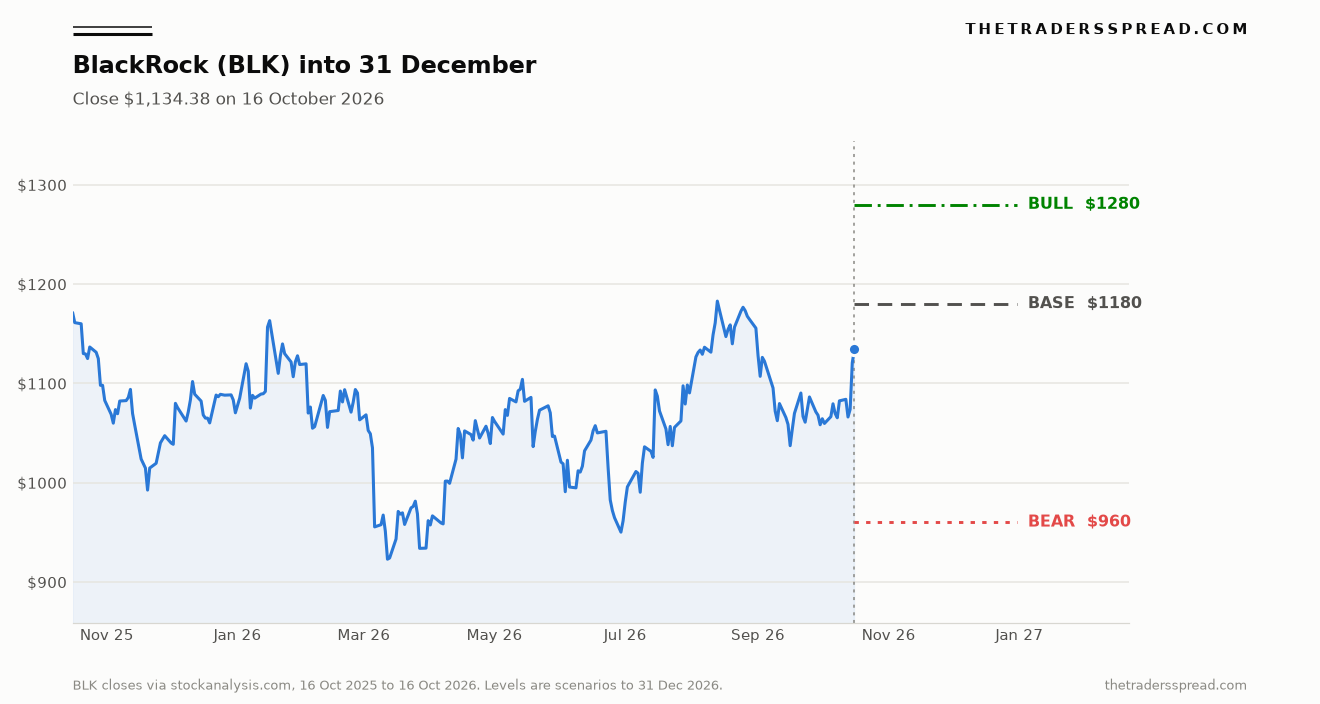
Daily closes from stockanalysis.com, pulled on 19 October 2026, run from $1,171.36 on 16 October 2025 to $1,134.38 on 16 October 2026. Over that year the share fell 3.2%, even after the rally that followed the print. The intraday high in the window is $1,209.89, on 16 October 2025. The intraday low is $917.39 on 12 March 2026, when the close was $922.90. From that March close the recovery is 22.9%. From the 31 December 2025 close of $1,070.34 the share is up 6.0%. From the 16 July close of $1,087.05 it is up 4.4%, and most of that three-month gain is three sessions.
Through late September and early October, BLK lived between about $1,053 and $1,090.
On 14 October the share opened at $1,088.63, traded to $1,062.79 and closed at $1,073.79, up 0.7% on 1.09 million shares. The call that morning was Fink, President Robert S. Kapito and Chief Financial Officer Martin S. Small. The larger move was the next day: up 4.4% to $1,120.78. On 16 October the close was $1,134.38, session high $1,149.90. After hours the quote was $1,130.51. The close is still 6.2% under last October's intraday high.
Shares outstanding including Subco units were 162.2 million at 30 September. Times the later close, that is about $184 billion. Nine-month adjusted diluted EPS was $42.37. Add another quarter at $15.93 and the constructed year is about $58.30, which puts the close near 19.5 times. GAAP earnings will not bear that sentence. The arithmetic is ours. It is not a company target.
An S&P 500 forecast is the equity beta in the fee line: equity AUM had a positive market change of $40.1 billion, and average AUM is how that beta becomes revenue.
A JPMorgan forecast is a balance-sheet lender. Fink's financing remarks rhyme with a bank. The earnings power does not. BLK's quarter is average AUM, fee mix and a subscription line.
The levels on the chart are a map. They are not orders.
| Path | Level | Versus the 16 October close | What has to hold |
|---|---|---|---|
| Bear | $960 | about 15% lower | The post-print rally is given back and the multiple compresses |
| Last close | $1,134.38 | the reference | stockanalysis.com, 16 October 2026 |
| Base | $1,180 | about 4% higher | Flows stay positive and the share holds the re-rating, under the old high |
| Bull | $1,280 | about 13% higher | Adjusted earnings run higher and the share clears $1,209.89 |
A margin that stayed at 30%
GAAP operating income was $2.328 billion, up 19% on the year and down from $2.461 billion in June. As-adjusted operating income was $3.330 billion, up 27% on the year. The adjusted margin rose to 47.8% from 44.6%. The GAAP margin did not rise. It was 30.0%, the same as a year earlier, and 4.7 points lower than June.
The opening bullets name the cause. The 25% rise in GAAP diluted EPS was "impacted by a noncash change in fair value of contingent consideration associated with prior acquisitions, which has been excluded from as adjusted results." On the income statement that line is $564 million, against $93 million a year earlier and $11 million in June. Amortisation of intangibles was $276 million, unchanged from June. Those two lines explain a large part of the gap between GAAP operating income of $2.328 billion and adjusted operating income of $3.330 billion. The quarter that looks better on the adjusted page looks flat, on margin, on the GAAP page, and sequentially worse.
Tax follows the same item. The GAAP effective rate was 29.4%, against 25.2% a year earlier. The notes say contingent-consideration marks are primarily not deductible. The adjusted tax rate was 24.2%, flat on the year. Adjusted net income attributable to BlackRock was $2.621 billion. GAAP net income attributable to BlackRock was $1.659 billion. Both are in the release. Using only the larger one is a choice, and it should be labelled.
Below the operating line, a non-cash gain of about $22 million on Circle Internet Group (a $115 million loss a year earlier) and about $80 million on Securitize helped swing adjusted non-operating income to $127 million, from a $106 million loss. Adjusted operating income rose 27%. Adjusted EPS rose 38%. The gap between those two rates is the non-operating swing.
Compensation rose $83 million on the year, to $2.440 billion. It did not take 4.7 points off the GAAP margin versus June. The contingent-consideration mark did. Technology revenue of $588 million, with annual contract value up 12% on Aladdin and multi-product solutions, is 7.6% of revenue: the cleanest growth line, and not yet big enough to set the multiple.
RelatedCoreWeave (CRWV) Falls 15.5% as 2031 Yield Nears 16%
The dividend was $5.73, against $5.21 a year earlier. One quarter is about 0.5% of the 16 October close. The $550 million repurchase is about 0.3% of the $184 billion equity value. It supports per-share figures. It does not re-rate the firm.
Three paths to 31 December
The base case is $1,180, about 4% above the 16 October close. Weight: 45%. Fink described a fourth quarter of "accelerating momentum, and a broad pipeline spanning whole portfolio, private markets, retirement, and our international platforms." The base assumes that pace, with organic base-fee growth still near 11% annualised and the adjusted margin in the mid-40s. It does not assume a new high. $1,180 sits under the $1,209.89 print from 16 October 2025.
The bull case is $1,280, about 13% above the close. Weight: 30%. The close is about 19.5 times a constructed adjusted year of $58.30. The same multiple on roughly $65.60, about 13% more earnings, is $1,280. That needs base fees to keep the mix shift, a fourth quarter that does not lean on one hedge fund, and fixed-income marks that stop subtracting on the scale of $117.4 billion. A higher equity market raises average AUM without any change in how clients behave.
The bear case is $960, about 15% below the close and above the March low of $917.39. Weight: 25%. On those same constructed earnings, $960 is about 16.5 times: a cheaper multiple, not a broken fee line. It is the path on which the 30% GAAP margin, the contingent-consideration charge and the index outflow are what the price follows, and the 6.4% rally is given back through the 13 October close of $1,066.12.
What would change the map. Organic base-fee growth breaking, or active and private-markets flows reversing, would pull the base toward the pre-print price. A smaller contingent-consideration item and a higher GAAP margin would make $1,280 look closer to a base. A close through $960 or through $1,280 before 31 December retires the map. The reference is $1,134.38. The target on the bull path is $1,280. The invalidation is $960. Conviction is moderate. The 45/30/25 weights are a desk allocation, not market-implied odds, and not a prompt to transact.
Questions the close leaves open
What is the BlackRock stock forecast into 31 December 2026?
The map is a base of $1,180, a bull case of $1,280 and a bear case of $960, against the $1,134.38 close on 16 October 2026. The bull case sits above that close and above the $1,209.89 high from a year earlier. The bear case sits below the close and below the 13 October price, before the release. The three paths organise the quarter's evidence. None of them is an instruction.
How large were third-quarter AUM and net inflows?
AUM was $15.488 trillion at 30 September 2026. Net inflows were $205 billion in the quarter, of which long-term flows were about $175 billion and cash about $31 billion. Over twelve months, net inflows were $869 billion and organic base-fee growth was 10%. In the quarter, annualised organic base-fee growth was 11%. Markets subtracted $60.1 billion, so ending AUM rose by less than the inflow. Source: the 14 October earnings release.
Why were GAAP and adjusted earnings so far apart?
GAAP diluted EPS was $10.57 and adjusted diluted EPS was $15.93. The GAAP operating margin was 30.0% and the adjusted margin was 47.8%. A non-cash change in contingent consideration on prior acquisitions, $564 million, is excluded from the adjusted results and is primarily not deductible, which is why the GAAP tax rate rose to 29.4%. Adjusted EPS also includes higher non-operating income. The operating comparison, on the adjusted line, is a 27% increase, not 38%.
How did the shares trade after the 14 October release?
BLK closed the release day at $1,073.79, up 0.7% from $1,066.12. It rose 4.4% on 15 October, to $1,120.78, and 1.2% on 16 October, to $1,134.38. Across three sessions the move was 6.4%, on volume of 1.09 million, 1.22 million and 1.14 million shares. Quieter days earlier in October were closer to 0.3 million to 0.5 million. Source: stockanalysis.com, retrieved 19 October 2026. After hours on 16 October the quote was $1,130.51.
What would make the bull case of $1,280 fail?
The bull case fails if organic base-fee growth breaks down, if new money narrows to low-fee institutional index, or if the share falls through $960. Another quarter of fixed-income market losses on the scale of $117.4 billion, without an offset from equities or from mix, would pressure the fee line that $1,280 depends on. One hedge fund with a September measurement date flattered liquid-alternatives performance fees. That line is not a permanent run-rate.
Does the dividend change the map?
The dividend for the quarter was $5.73 a share, up from $5.21 and flat on June. On the 16 October close that is about half a percent. A yield near 2% appears only if $5.73 is paid four times, which this release does not promise. The $550 million repurchase is small next to an equity value near $184 billion. The cash distribution does not close the gap between $1,134.38 and either $1,280 or $960.
This is analysis, not advice. Scenario levels are a desk view of BlackRock's 14 October 2026 earnings release and of the share price since, and they can be wrong. Capital is at risk. The release covers the quarter ended 30 September 2026. Prices are from stockanalysis.com as retrieved on 19 October 2026. Past performance is not a guide to future results.