

Super Micro did not raise its year on 20 October. The preliminary note reset the quarter ended 30 September and stopped. Revenue is now estimated at $18.5 billion to $19.5 billion, against $14.5 billion to $15.5 billion, "primarily due to increased demand for AI platforms." Gross margin is estimated at 12.0% to 12.5%, against 10.4% to 10.8%, "primarily due to customer and product mix." Both lines are in Exhibit 99.1 to that day's Form 8-K. Neither is a new forecast for the year to 30 June 2027.
A parallel $4 billion lift at each end of one quarter looks like a guidance raise. It is not, until someone says the later quarters keep it. On 11 August the company had already set fiscal 2027 net sales at $65.0 billion to $72.0 billion. The October exhibit does not mention that range, does not replace the August earnings band, and does not give cash, inventory, or a new backlog. The accountant, the exhibit says, has not audited, reviewed, compiled, or performed any procedures on these two preliminary figures.
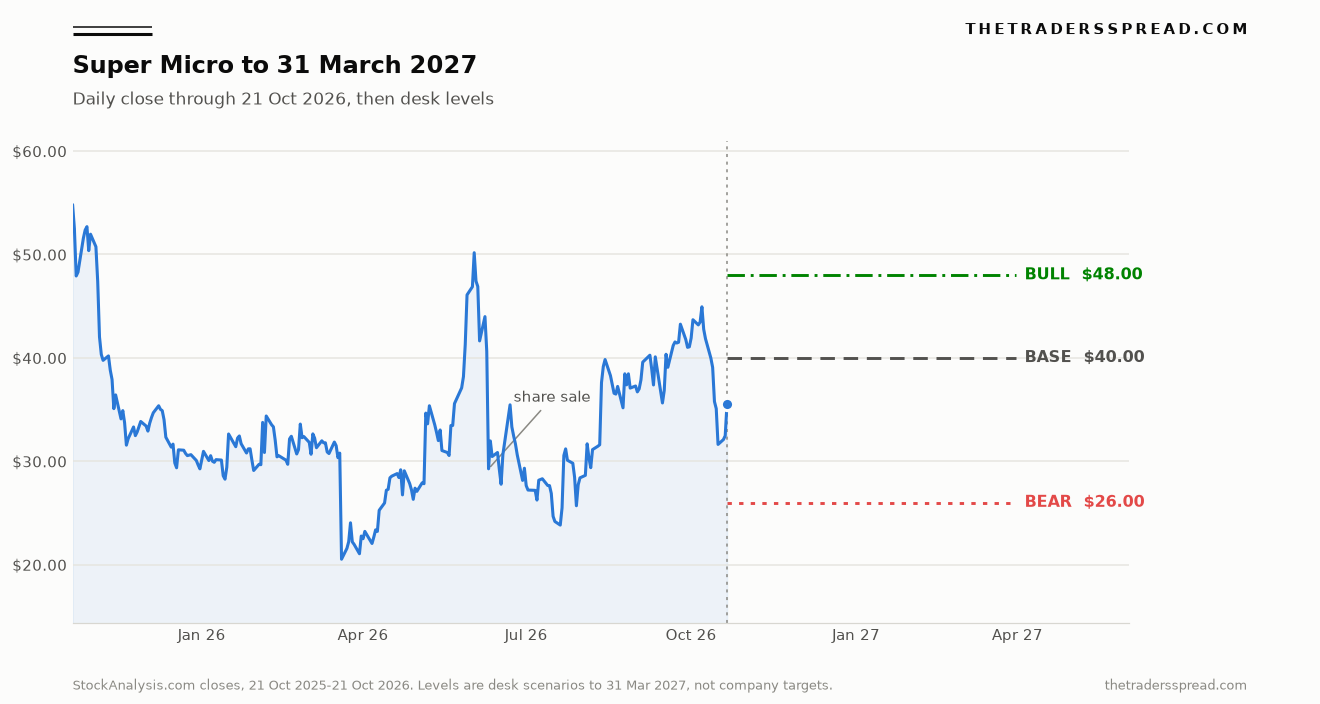
StockAnalysis recorded a Nasdaq close of $35.57 at 4:00 p.m. Eastern on 21 October 2026, up $3.10, or 9.55%, from $32.47, on 82,457,951 shares. We pulled the quote and a year of closes on 22 October. The session opened at $36.42, reached $37.45, and settled $1.88 under the high. After hours the print was $35.00. Ours is the regular close.
Our bull case is $48. Our bear case is $26. The gap between them is whether 3 November treats the $4 billion as extra demand or as timing inside a year that was already public.
1. One quarter, not the year
Item 2.02 furnishes the release. It is not deemed filed for Section 18. The exhibit warns that actual results may differ materially from management's estimates. The webcast is the first scheduled place for everything else: Tuesday, 3 November 2026, at 5:00 p.m. Eastern.
The last earnings number on a quarter is still August's, and it sat on the old band: sales of $14.5 billion to $15.5 billion, GAAP net income of $0.89 to $0.98 a diluted share, non-GAAP $1.01 to $1.10. That GAAP line assumed a 20.1% tax rate, 745 million diluted shares, and about $106 million of stock-based pay net of $32 million of tax. None of it was rewritten on 20 October.
The year was. Once. In August. "For fiscal year 2027, the Company expects net sales in the range of $65.0 billion to $72.0 billion." A headline that calls this week a full-year raise is describing a document the exhibit is not.
2. Where $4 billion goes inside $65 billion
The midpoint steps from $15.0 billion to $19.0 billion, up 26.7%. Against the September 2025 quarter, $5.02 billion in the company's XBRL facts, the new midpoint is about 279% higher. That is a small base, not the year already in writing. Fiscal 2026 sales were $39.06 billion. The August guide was already a large step from there.
A confirmed $19 billion September quarter is about 28% of a $68.5 billion midpoint year. Front-loaded. Not proof the next three quarters repeat it.
If the year prints at the $65 billion floor and September at $19.5 billion, the other three quarters average about $15.2 billion, inside the old guide. If the year prints at $72 billion and September at $18.5 billion, they average about $17.8 billion, still inside the August year. Only a statement that later quarters keep the $4 billion forces the range up. The October note does not contain it.
3. Gross profit dollars, not the 12% rate
Twelve percent looks thin next to June's 17.5% gross margin. The dollars do not.
The new endpoints imply about $2.22 billion of gross profit at the low corner, $18.5 billion at 12.0%, and about $2.44 billion at the high corner. The old band implied about $1.51 billion to $1.67 billion. The new low clears the old high by about $550 million. June, $11.1 billion at 17.5%, was about $1.94 billion of gross profit. The bottom of the new range beats that spike by about $280 million, on a lower rate, because the sales base is larger.
June was the outlier. Gross margin was 9.3% in September 2025, 6.3% in December, 9.9% in March, then 17.5%. The year was 10.8% on $4.23 billion of gross profit. A 12% to 12.5% preliminary recovers against that year. It does not restore the one fat quarter.
| Measure | Revenue | Gross margin | Gross profit |
|---|---|---|---|
| Q1 FY27 prior guide, 11 Aug 2026 | $14.5 billion to $15.5 billion | 10.4% to 10.8% | $1.51 billion to $1.67 billion |
| Q1 FY27 preliminary, 20 Oct 2026 | $18.5 billion to $19.5 billion | 12.0% to 12.5% | $2.22 billion to $2.44 billion |
| Q4 FY26, reported 11 Aug | $11.1 billion | 17.5% | $1.94 billion |
| FY26, Form 10-K | $39.06 billion | 10.8% | $4.23 billion |
| FY27 sales guide, not updated 20 Oct | $65 billion to $72 billion | Not given | Not given |
Guide-row gross profit is the product of the company's endpoints, not a figure Super Micro published. June gross profit is the release's sales times its margin. The year row is the Form 10-K.
Nvidia's $108 billion third-quarter guide, from our 27 August note, is demand context. It is not a margin this company has claimed. The preliminary puts the integration spread at about twelve cents on the sales dollar. One supplier was 63.1% of fiscal 2026 purchases. The risk factor does not name the supplier. The business section, separately, describes Blackwell, Blackwell Ultra, and upcoming Vera Rubin systems. We are not merging those sentences into one identity.
4. The cash left through inventory
Fiscal 2026 net income was $2.23 billion, $3.26 a diluted share. Operating cash flow was a use of $6.81 billion. A year earlier cash from operations had been a source of $1.66 billion.
Inventory went from $4.68 billion at 30 June 2025 to $12.90 billion a year later, about a third of sales. Receivables ended at $6.13 billion. Three customers were 23.0%, 17.1%, and 12.5% of that balance. One customer was 10% or more of sales. The 10-K names none of them.
Cash ended at $7.52 billion. The August release rounds bank debt and convertible notes to $8.7 billion, so net debt on those two figures is about $1.2 billion. Financing, not operations, rebuilt the cash. On 10 June the company sold 45,454,545 shares at $27.50, about $1.25 billion gross and $1.22 billion net. The option added 6,818,181 shares on 18 June, about $183 million more net. The cover counts 656,965,384 common shares at 31 July 2026.
That July count at $35.57 is about $23.37 billion. The guide's 745 million diluted shares are about $26.50 billion at the same price. We do not stack convertible principal on the diluted count. The $8.7 billion line does not split bank debt from converts. $35.57 is 10.9 times the reported $3.26. $48 would be 14.7 times, still under the $54.82 close of 21 October 2025.
Charles Liang, founder, president and chief executive, said this on 11 August in the earnings release: "Our Total AI/IT Solutions strategy continues to deliver strong results, we added several hundred enterprise and other customers in the past year, generated more than $60 billion in new orders, and booked record backlog entering fiscal 2027." Three months old. This week's exhibit does not refresh the $60 billion or the word "record."
CoreWeave is one indebted buyer in the build-out, not a customer we are naming off the 10-K. Revenue can print while cash sits in the receivable. Dell is the other large assembler on this tape.
5. The close, after the path into it
The low close in the pulled year was $20.53 on 20 March 2026. The 30 September close was $41.07. On 20 October, before the reaction session, the stock was $32.47, about 21% under that September mark. The preliminary is dated 20 October. The regular-session move is the next day.
$35.57 is still about 13% under 30 September and about 35% under $54.82. StockAnalysis lists a 52-week high of $55.35 and a low of $19.48 and does not date them. Those are not our closing prints.
The close fell from $40.64 on 9 June to $29.27 on 10 June, $1.77 above the $27.50 deal. Above the deal, below September. A bounce inside a drawdown.
Reuters posted the day as an AI-sentiment session, SpaceX in the same sentence as Super Micro. The exhibit is narrower than that frame. One furnished quarter moved.
The tech-heavy Nasdaq led Wall Street to a higher close after quarterly results from SpaceX and Super Micro Computer improved investor appetite for artificial intelligence-related stocks https://t.co/SPtYTMhXfV pic.twitter.com/Ek9G0TWhbn
— Reuters (@Reuters) October 22, 2026
6. Three prices to 31 March 2027
This Super Micro stock forecast runs to 31 March 2027, through the 3 November webcast and the December quarter. Weights are ours. Base 40%, bull 35%, bear 25%. The weighted level is about $39, roughly 10% above the print. Conviction is 3.
RelatedBlackRock (BLK) Forecast: $1,280 Bull vs $960 Bear
Base, $40. November confirms both new bands. The year stays at $65 billion to $72 billion, or nudges only at the edge. Cash flow is mixed, neither another multi-billion use nor a clean conversion. Forty dollars is 12.3 times the old $3.26. A premium to the print because the gross-profit math survived, and no re-rating, because the year did not change.
Bull, $48. The quarter is confirmed, and management either lifts the year through $72 billion or says later quarters hold, so the $4 billion is not given back. September operating cash flow is a source, or only a small use. Forty-eight dollars is 14.7 times fiscal 2026 earnings and about 35% above the print. It does not need last October's $54.82 close. It does need the market to capitalise a bigger year without another inventory surge.
Bear, $26. The preliminary is revised toward the old $14.5 billion to $15.5 billion band, or revenue stands and cash looks like fiscal 2026 in miniature. A break of the $27.50 deal price would say the June capital did not settle it. Twenty-six dollars is 8.0 times the $3.26, under the $29.27 close of 10 June, and still above the March low. A confidence break, not a return to that low.
Fiscal 2026 net income was 5.7% of sales. On a $68.5 billion midpoint year that is about $3.9 billion, or about $5.25 on 745 million diluted shares. The print is about 6.8 times that sketch, $40 about 7.6 times, $48 about 9.1 times, and $26 about 5.0 times. The sketch needs the margin, the year, and the share count to hold. October affirms none of them. On this arithmetic the bull case is a low multiple on an unchanged year, not a peak multiple.
7. What would change the call
Five facts would make us drop the bull case. None of them is an instruction to trade.
- Reviewed revenue or gross margin lands outside the 20 October bands. The gross-profit gap we are using disappears with them.
- The full-year range is cut below $65 billion, which would mark September as pull-forward. A raise through $72 billion would push the other way, because the $4 billion would have been declared extra.
- Operating cash flow is a large use, or inventory rises by billions again. Revenue without cash is already the 10-K pattern. Another turn makes $48 the wrong map.
- A further sale near or under $27.50, or a diluted count well above 745 million, changes what $35.57 means per claim.
- The 3 November call ties the margin to concentration worse than fiscal 2026, one customer at 10% or more of sales and one supplier at 63.1% of purchases, rather than to mix that can last.
We would drop the bear case if the quarter is confirmed, the year is raised, and operating cash flow is a source. That trio is not in any document dated 20 October. It is what 3 November can add. The levels are a way to read those prints against $35.57.
What is the smci stock price prediction in this note?
The smci stock price prediction here is three levels to 31 March 2027, not one target. Base $40, bull $48, bear $26, against the $35.57 regular close on 21 October 2026. We weight them 40%, 35%, and 25%. The bull is above the print and the bear is below it. The weights are a desk judgment, not a market price.
Did Super Micro raise the fiscal 2027 sales range this week?
No. On 11 August the company set fiscal 2027 net sales at $65.0 billion to $72.0 billion. The 20 October exhibit moves only the September quarter, to $18.5 billion to $19.5 billion of revenue and a 12.0% to 12.5% gross margin. It does not restate the year, the August earnings band, or the 745 million diluted shares used there. A quarterly lift can still sit inside the year if later quarters are softer.
How can gross profit rise when the margin is 12%?
Because sales jumped by more than the rate gave back. The low corner of the new range, $18.5 billion at 12.0%, is about $2.22 billion of gross profit. June, $11.1 billion at 17.5%, was about $1.94 billion. The old September guide, at its high corner, was about $1.67 billion. A lower rate on a much larger quarter can clear both. The comparison dies if 3 November revises the preliminary down.
Why is the cash flow the open question?
Fiscal 2026 net income was $2.23 billion and operating cash flow was a use of $6.81 billion. Inventory ended at $12.90 billion. The 20 October note gives revenue and gross margin only. It says nothing about receivables, inventory, or cash. Another working-capital build would absorb the extra gross profit the new range implies. A confirmed margin without a cash figure would leave the bull case unfinished.
What would put $26 in play before March?
A revision of September back toward the old $14.5 billion to $15.5 billion guide, or confirmed revenue with cash going out and inventory rising again. Twenty-six dollars is below the $27.50 price of the 10 June sale and below that day's $29.27 close. It is still above the $20.53 closing low of 20 March 2026. A break of the deal price would mean the bear case had become the tape, not a cue to act.
When does the reviewed quarter arrive?
Super Micro scheduled the webcast for Tuesday, 3 November 2026, at 5:00 p.m. Eastern. That is the first date given for reviewed figures, including earnings per share, operating expenses, and cash, none of which the preliminary supplied. The exhibit says the accountant has performed no procedures on the ranges. Until that webcast, $18.5 billion to $19.5 billion is an estimate the company has already warned can change.