After a subdued start to the week due to the Easter Monday holiday, investors found some support on the early signs that the new COVID-19 cases are easing in some countries, in addition to some of the biggest oil production cuts in history.
Yet, it was another week of indecisiveness as investors’ attention switched to the earnings season to get a sense of the damage caused by the pandemic while monitoring any developments that could indicate a return to “normality”.
- OPEC+ Agreement
- IMF Forecasts: Australia V-shaped Recovery
- Economic Data
- Gold Above $1,700
OPEC Agreement
The historic OPEC deal failed to lift crude oil prices, which are being crushed by the demand crisis. The OPEC and non-OPEC Ministerial meeting reaffirmed the continued commitment of the participating producing countries in the Declaration of Cooperation.
OPEC+ is also relying on the international cooperation of the G20 countries in stabilising the energy markets. Overall, the agreement reflects the coordinated commitment and is bringing some positive reassurance on the long haul.
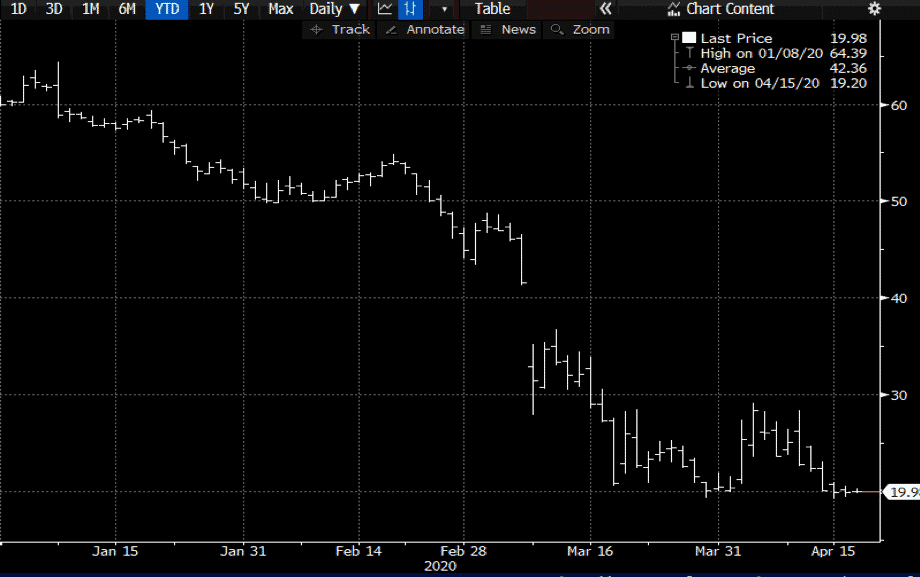
However, various oil forecasts continue to paint a dire outlook for oil demand amid travel bans and lockdowns during the pandemic.
On the supply side, weekly reports have shown a significant increase in crude oil inventories. During the week, WTI traded at the lowest level since the beginning of the year at 19.20, despite the agreement.
IMF Forecasts
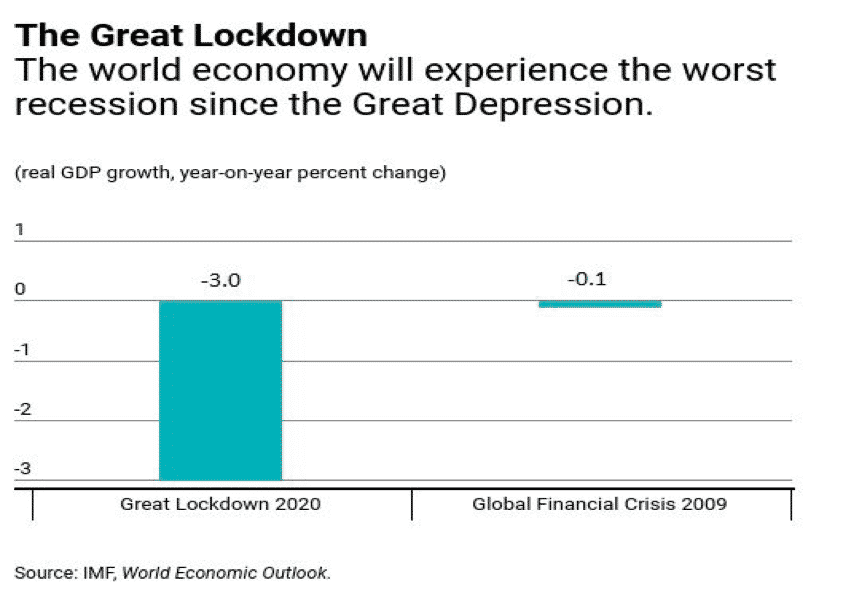
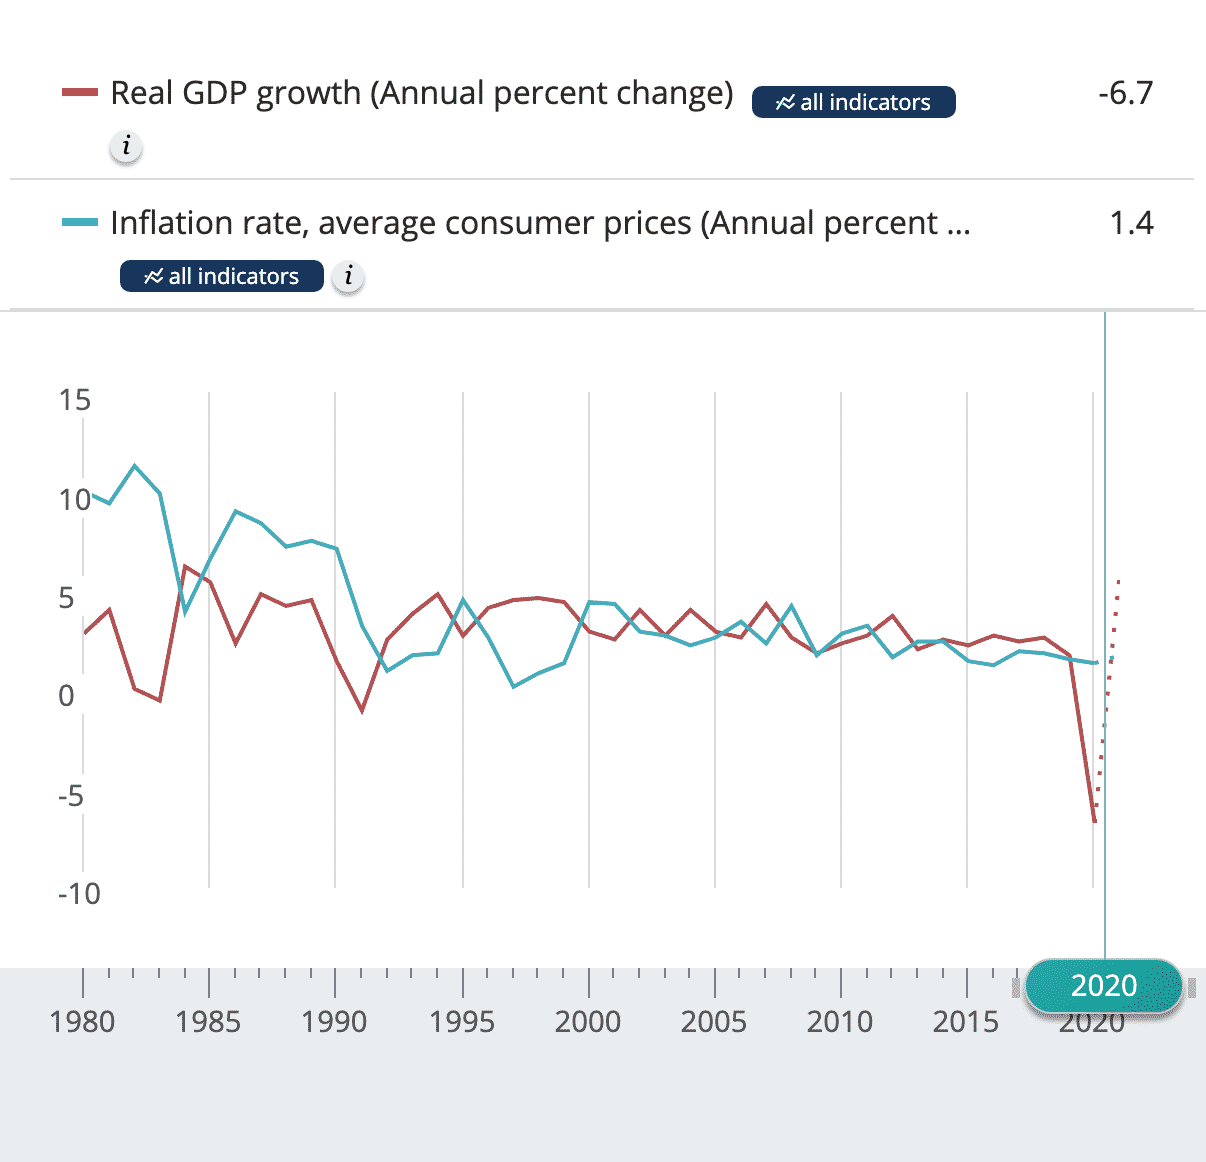
The International Monetary Fund (IMF) has predicted in its 2020 World Economic Outlook that the economic impact of the COVID-19 pandemic might result in the “worst recession since the Great Depression”.
The IMF expects the world economy to contract by 3% in 2020 due to the various forms of lockdown seen across the globe. The magnitude and speed of the collapse resulting from unexpected quarantines and social distancing measures necessary to fight a pandemic is unprecedented, and the contraction looks far worse than the last recession.
In Australia, the IMF predicted a contraction of 6.7%, which marks the worst since the Great Depression in 1931. However, the IMF is also predicting an optimistic V-shaped recovery in 2021.
Country Data
US Earnings
On the earnings front, banking giants reported their first-quarter earnings. As widely expected, banks like JP Morgan, Wells Fargo, Citigroup, Bank of America, Goldman Sachs and Morgan Stanley all reported a significant drop in profits tied to the pandemic.
While the share price of most of those banks dropped by more than 10% this week, Goldman Sachs and Morgan Stanley flared better compared to their peers, with a fall of 5% or less.
To the exception of asset management revenues, which slipped in Q1, Goldman Sachs’ investment banking, global markets, consumer and wealth have performed relatively well given the current situation. Similarly, Morgan Stanley’s results were also not all bad – sales & trading and the wealth management division posted strong results.
Economic Data
As investors are bracing themselves for dreadful figures, economic data in China is showing some early signs of recovery:
- A better-than-expected increase in trade surplus: Trade Balance (USD) came in at +19.9B vs the expected +18.00B.
- Above-forecasts exports and imports: Exports (YoY): -6.6% vs-15.0% (expected), Imports (YoY): -0.9% vs-8.0% (expected)
- Industrial Production recovered from -13.5% in February to -1.1% in March.
On the downside, GDP and Retail Sales contracted more than expected by -6.8% and -15.8%, respectively. The overall data does not paint a bright outlook for China but does provide some reassurance that the economy is picking up slowly.
China has only recently started to lift lockdown restrictions, and investors will likely continue monitoring economic releases in the upcoming weeks and months for signs of a promising recovery.
In the United States, most economic releases are showing record falls or figures seen a decade ago, reiterating that the global pandemic is having a much-worse effect on the US economy than the financial crisis.
- Retail Sales fell by a record of 8.7% in March. Food and beverage stores were up by 28%, while clothing and clothing accessories were impacted the most.
- Industrial Production fell 5.4% in March as the pandemic led many factories to suspend operations late in the month. The decreases in total industrial production and manufacturing were their largest since 1946.
- NAHB Housing Market dropped by 42 points in April to 30. It is also the first time that builder confidence has been in negative territory (below 50) since June 2014.
- Empire Manufacturing index figures showed that activity has declined at a historic pace. The general business conditions index fell to -78.2, and it is the largest point drop to its lowest level on record.
- Philadelphia Fed Manufacturing Survey: The index for current activity has declined for the second consecutive month from -12.7 to -56.6. The index fell below the lowest level seen during the Great Recession.
- Housing Sector: The housing data were mixed – Building Permits dropped in March 2020 but came above expectations at 1.353M while Housing starts recorded the largest one-month decline since 1984.
- Jobless Claims: In the week ending April 11, initial claims were 5,245,000, which represents a decrease of 1,370,000 from the previous week’s revised level. The jobless claims figures over the past month show a reversal of roughly the amount of jobs that have been added to the US economy since the financial crisis.
Employment reports were the main economic events on the Australian calendar. Surprisingly, the pandemic-induced crisis does not seem to have hit hard the labour market in March at first glance.
The jobs market added 5.9K jobs, and the unemployment rate came better-than-expected at 5.2% compared to the forecasted 5.5%. While the unexpected rise can partially be justified by the growing demand by supermarkets and associated supply chains, the data is not a full representative of the whole month.
The data did not reflect the end of the month data when the government started to impose stricter social distancing rules and additional shutdowns. April job figures will, therefore, be more relevant and accurate.
Haven Appeal
Gold
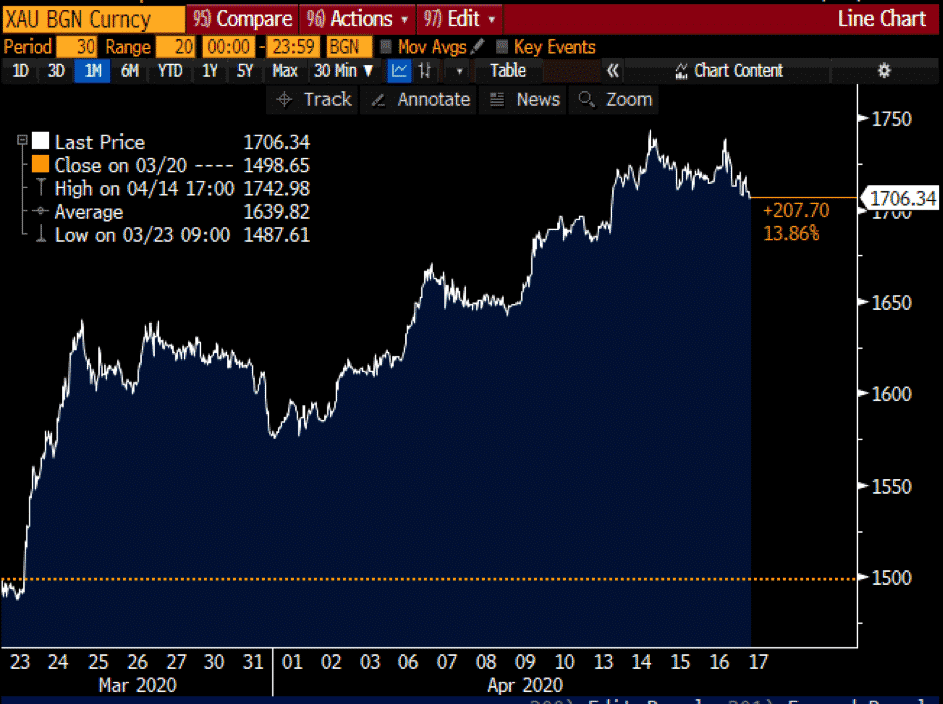
The yellow metal rallied to a multi-year high above a key psychological level of $1,700. While the overall outlook for gold remains positive, given the current uncertainties, a stronger US dollar towards the end of the week has tamed the bid momentum.
As of writing, the pair eased to $1,706 after reaching a high of $1,742.98 earlier this week.
The Mighty Dollar
Major currencies were mostly weaker against the US dollar. Despite a series of disappointing data, the greenback is edging higher, lifted by its haven appeal compared to its peers.
The US dollar index, which tracks the performance of the greenback against a basket of currencies, was firmer this week and is trading just below the 100 level.
Upcoming Earnings Report
|
Company
|
Reporting Time
|
Teleconference/ Webcast Time
|
|
Schlumberger Ltd (NYSE: SLB)
|
Today before the bell at 7:00 AM (ET)
|
At 8.30 AM (ET), results will be reviewed via a conference call.
|
Key Economic Events
|
Source: www.gomarkets.com