MarketMap Issue #8
April 15, 2020
You see in social media permeating the public domain the fractal overlays of 1929 with the most recent panic sell-off. The problem with this parallelism it is not anchored to anything at all except the similarity visually when resized and overlaid with each other.
ContraryThinker uses a method discovered in 2000 that I have advanced called the Event-Based Cycle (ECB) that produces a similar peak to low intervals, it projects related date windows for tops and bottoms based on how the highs are anchored with each other mathematically. The charts below provide what is expected to be the scenario of the market going into late summer; along with an alternate scenario main difference of the low this year hitting later than the others.
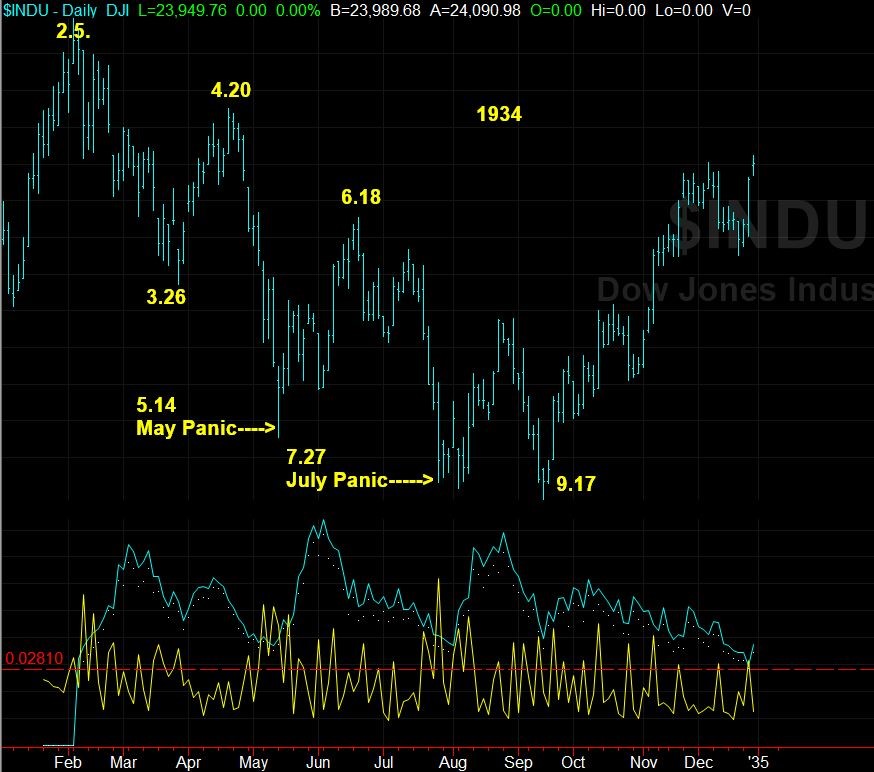
The chart of 1934 reveals two months on the S-T horizon where long bars will be of a size that, with an excellent short-selling futures scalping system, will make your year. The 1923 bear that peak in the same season as 1934 with the same tidal angles experienced the same scenario seen below with mini panics in May and July.
In the 1956-chart, the seasonal peak occurred the early spring time frame, and importantly you can see the default Tidal wave systems going short after the peak, which puts the ’56 top in the tidal angle of the other major peaks.
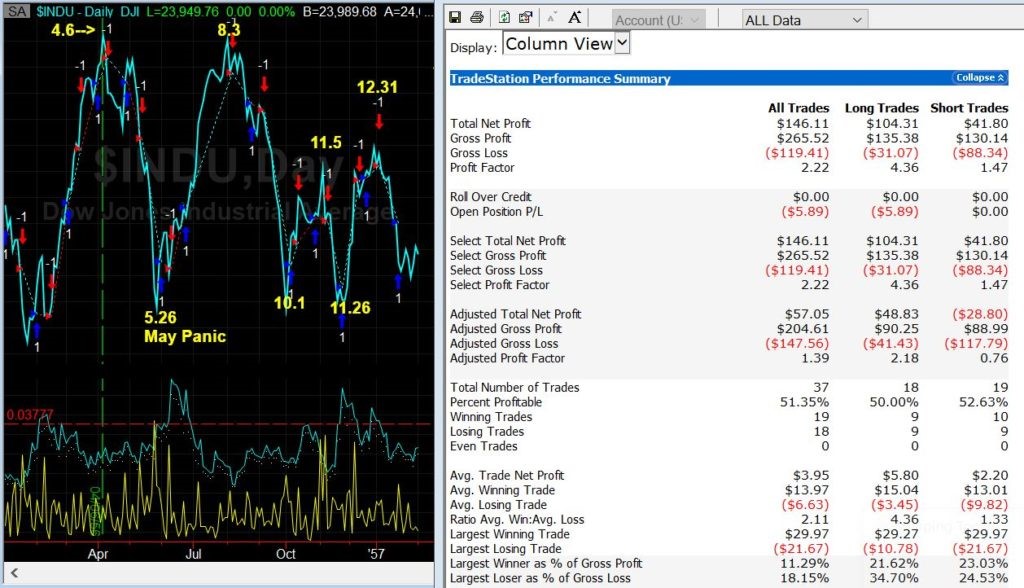
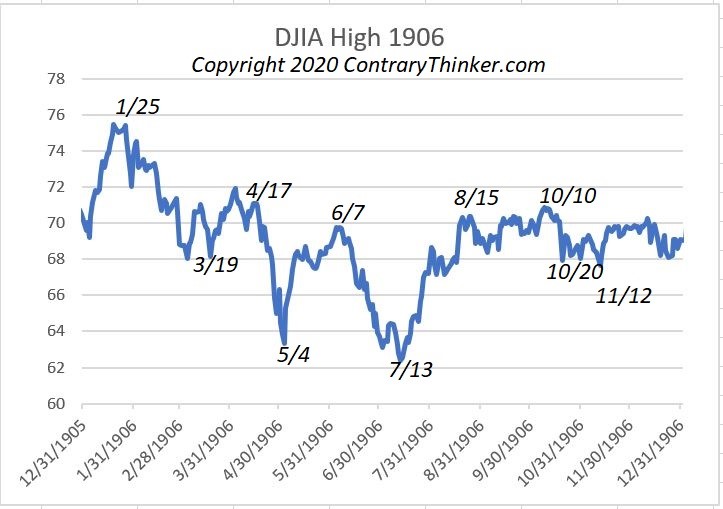
You can see the panic low in May, but from there, the pattern differs with a secondary peak in August before the panic decline into early October.
So we have 1906, 1923, 1934 and 1955 with similar patterns for stock prices going into late summer and the end of the year.
What is interesting is the Decennial overlay of the years that end in zero produces a similar pattern as the four years above with a peak in the current time window with brisk selloffs into May and a crash low in July.
Decennial 10-year cycle model
Dow 1934 Event-Based Cycle
I am sure that my long-time subscribers and strategy traders since 2011 have seen the Market Map become more and more accurate. Couple that with our volatility model and our overbought/oversold model, we can beat the best.
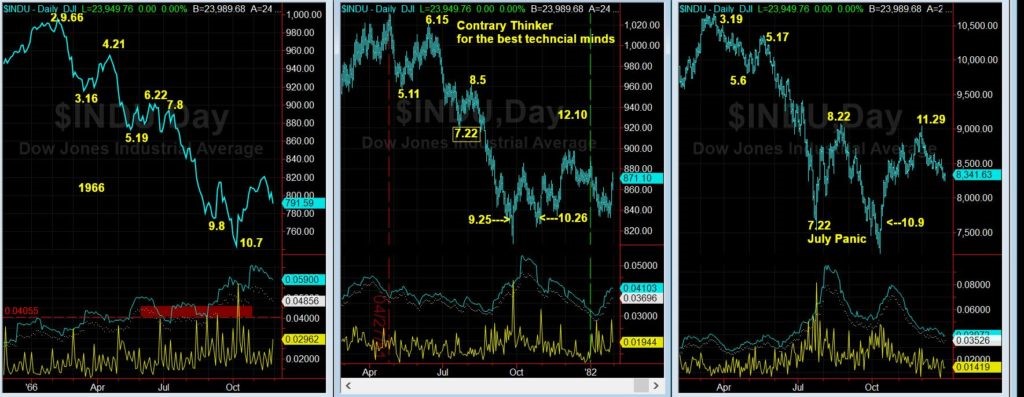
The three alternative scenarios are not far off from the above. They all decline into May and July with one mini Panic in July. The most significant difference is the decline follows through into September and October.
Three Alternative Scenarios Look the Same
As a sidebar, it is my premise that a hedge fund can trade three to five times a year and achieve a 30% plus annual return with less than a 2% drawdown. Join Contrary Thinker and provide your inputs and work with my group to advance your investment policy.
https://contrarythinker.com/early-spring-subscription-discount/
Protect yourself, plus learn how to hedge. Join today.
Copyright 1989-2020.
Contrary Thinker 1775 E Palm Canyon Drive, Suite 110- box 176 Palm Springs, CA 92264 USA. 800-6183820 or 25/1 Poinsettia Court Mooloolaba, QLD Australia 4557 614-2811-9889
— Contrary Thinker does not assume the risk of its clients trading futures and offers no warranties expressed or implied. The opinions expressed here are my own and grounded in sources I believe to be reliable but not guaranteed.
— Pricing is subject to change without notice. My indicators and strategies can be withdrawn for private use without notice, at any time.
— Contrary Thinker does not refund policy; all sales are the finale.
Trading futures and options involve the risk of loss. Please consider carefully whether futures or options are appropriate for your financial situation. Use only risk capital when trading futures or options.