
- Wheat reversed from support level 580.00
- Likely to rise to 613.00
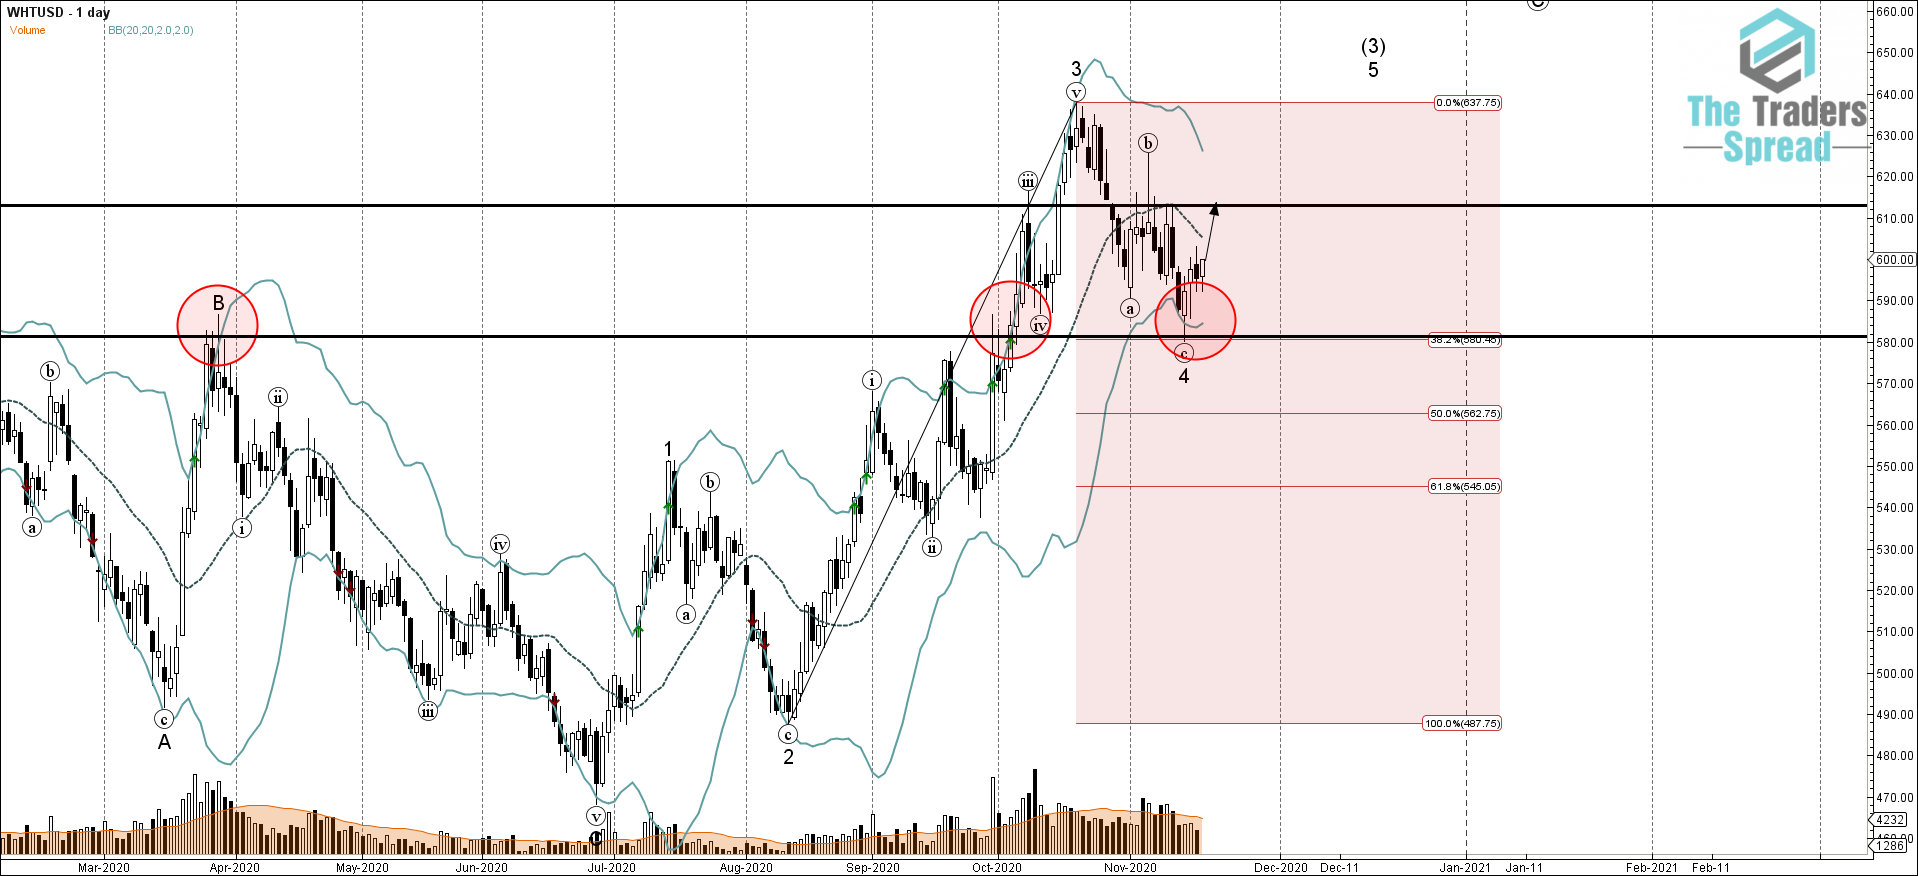
Wheat recently reversed up with the daily Piercing Line candlestick reversal pattern from the key support level 580.00 (former strong resistance from March and September), intersecting with the lower daily Bollinger Band and the 38.2% Fibonacci correction of the previous sharp unwrap impulse 3 from the start of August. The upward reversal from the support level 580.00 started the active short-term impulse wave 5.
Given the predominant uptrend that can be seen on the daily Wheat charts – the price is likely rise further in the active impulse waves 5 and (3) toward the next resistance level 613.00 (top of the previous Bearish Engulfing reversal pattern which formed earlier this month).
Was this post helpful?
Let us know if you liked the post. That’s the only way we can improve.


