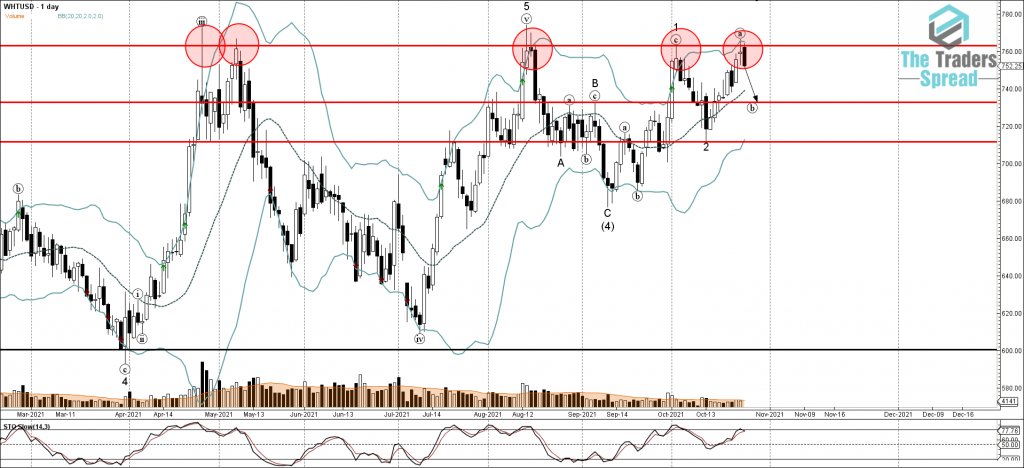
• Wheat reversed from long-term resistance level 763.00
• Likely to fall to support level 732.60
Wheat recently reversed down with the daily Japanese candlesticks reversal pattern Long-legged Doji from the key long-term resistance level 763.00 (which has been reversing the price from the end of April, as can be seen from the daily Wheat chart below) – strengthened by the upper daily Bollinger Band. The downward reversal from this resistance level started the active minor corrective wave (b).
Given the strength of the aforementioned resistance level 763.00 and the overbought daily Stochastic, Wheat can be expected to fall further toward the next support level 732.60 (target price for the completion of the active wave (b)).


