
This week, there was no clear direction as to where the market is heading with the equities market rallying 4.5% up in a day and 2% down in another. It seems like the unwinding of carry trades remained a main theme in the forex market as we saw the EUR, JPY and CHF edged higher. Elsewhere, USD and CAD tumbled lower as the FED and BoC delivered a 50bps rate cut this week, much to the market’s surprise. Looking ahead, investors will be keeping a close watch on ECB’s interest rate decision and Eurozone’s GDP data where missing estimates or signals of a rate cut; following in the 3 central banks’ footsteps this week (RBA, FED, BOC) could see the EUR pare recent gains. Given th e current global outlook with the Covid-19 outbreak showing no signs of slowing down worldwide, positive surprises in economic data could have a minimal impact on the currencies and the market risk sentiment.
CURRENCY: USDJPY
USD/JPY Chart
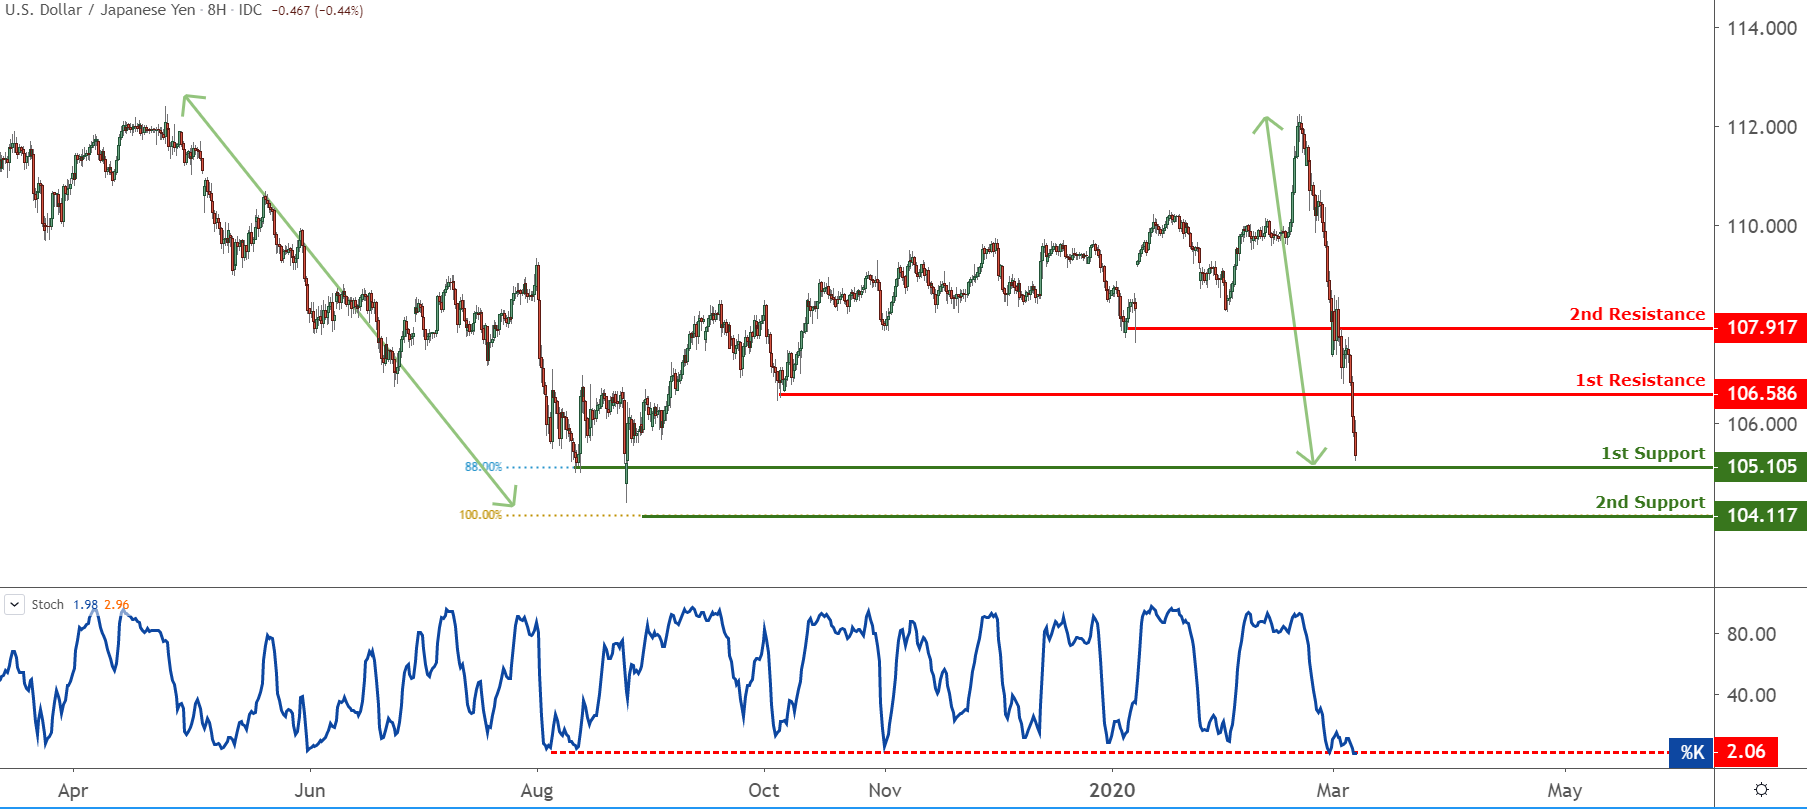
Price is facing bullish pressure from our first support where we could see a bounce above this level to our first resistance level. Stochastic is showing signs of oversold as well.
CURRENCY: GBPUSD
GBP/USD Chart
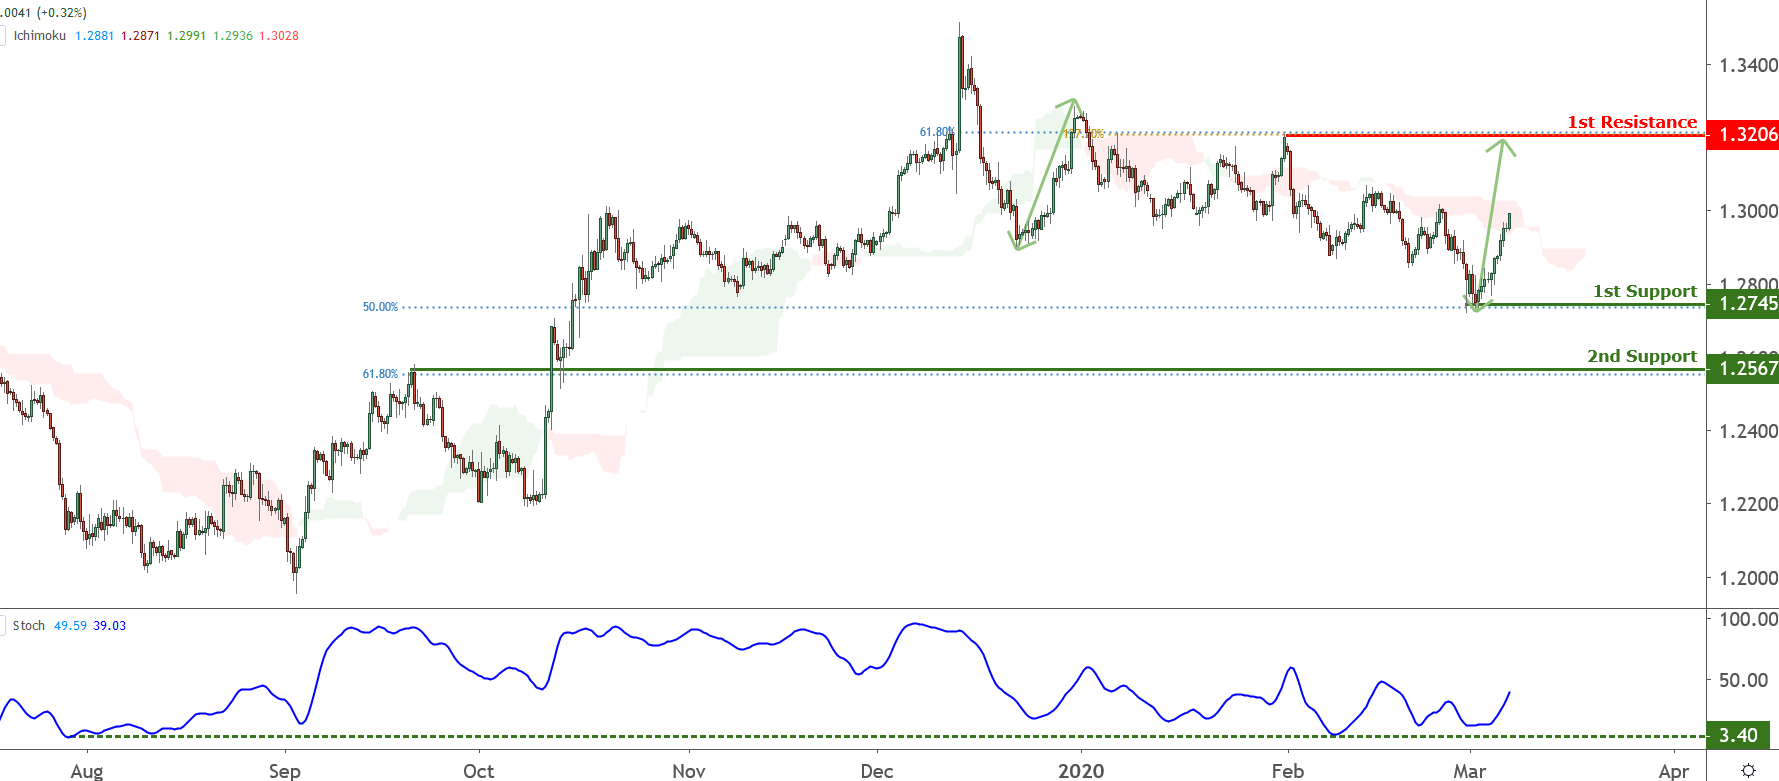
Price is facing bullish pressure from our first support where we could see a further push up to our first resistance level. Ichimoku cloud and Stochastics is also showing signs of bullish pressure as well, in line with our bullish bias.
CURRENCY: USDCNH
USD/CNH Chart
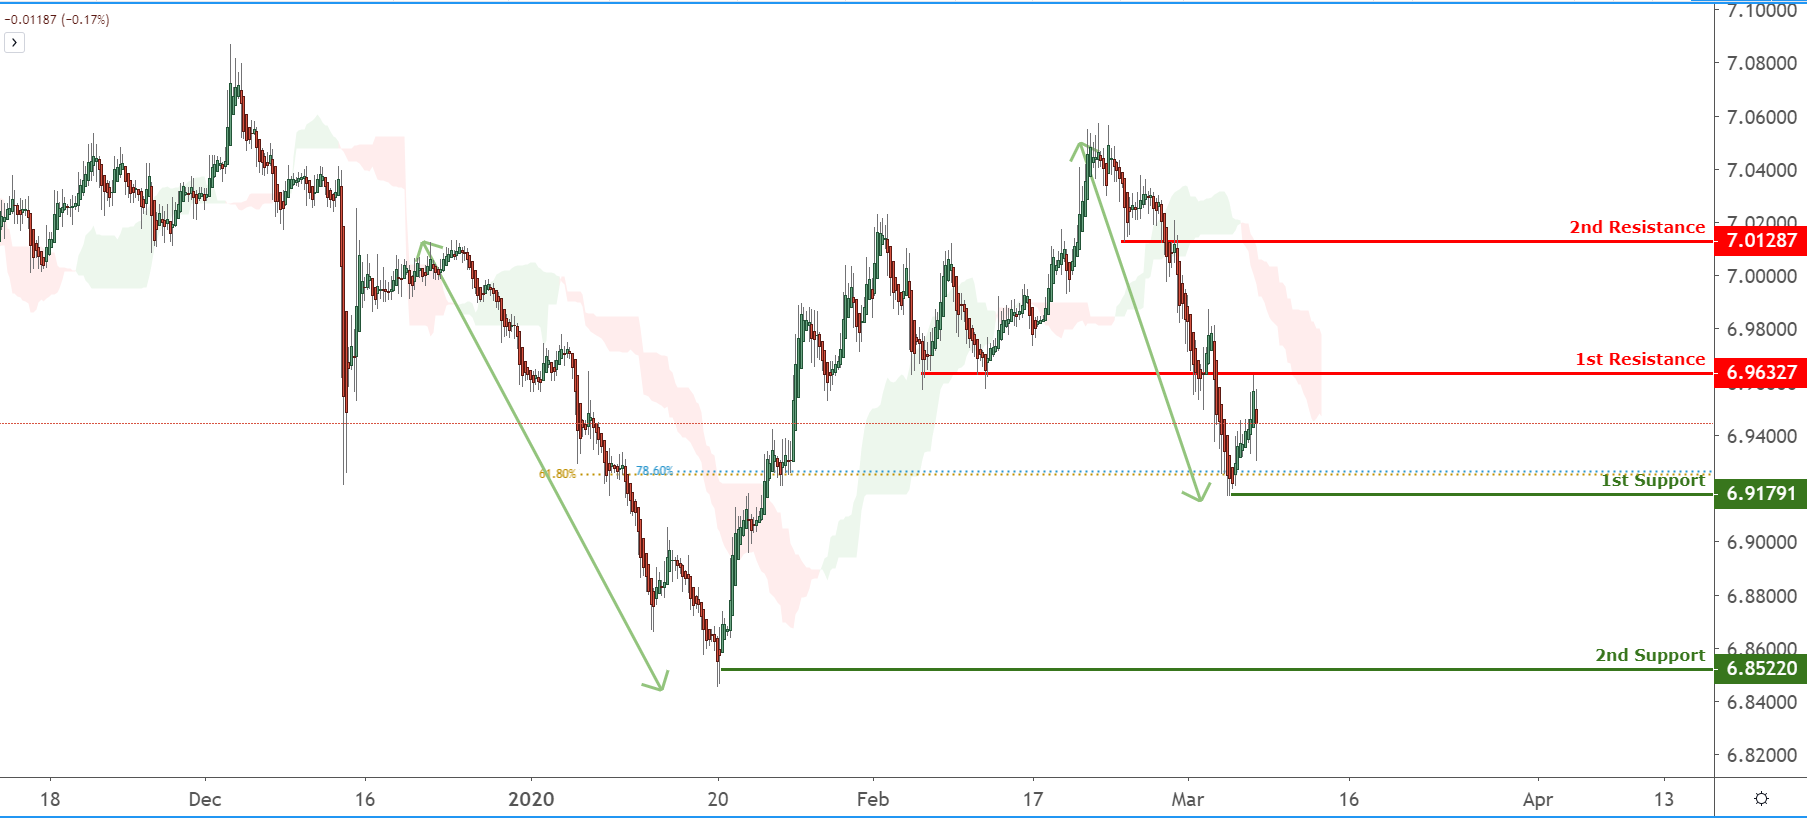
Price is facing bearish pressure from our Ichimoku cloud and our first resistance level where we could see a further drop to our first support level.
CURRENCY: SPX
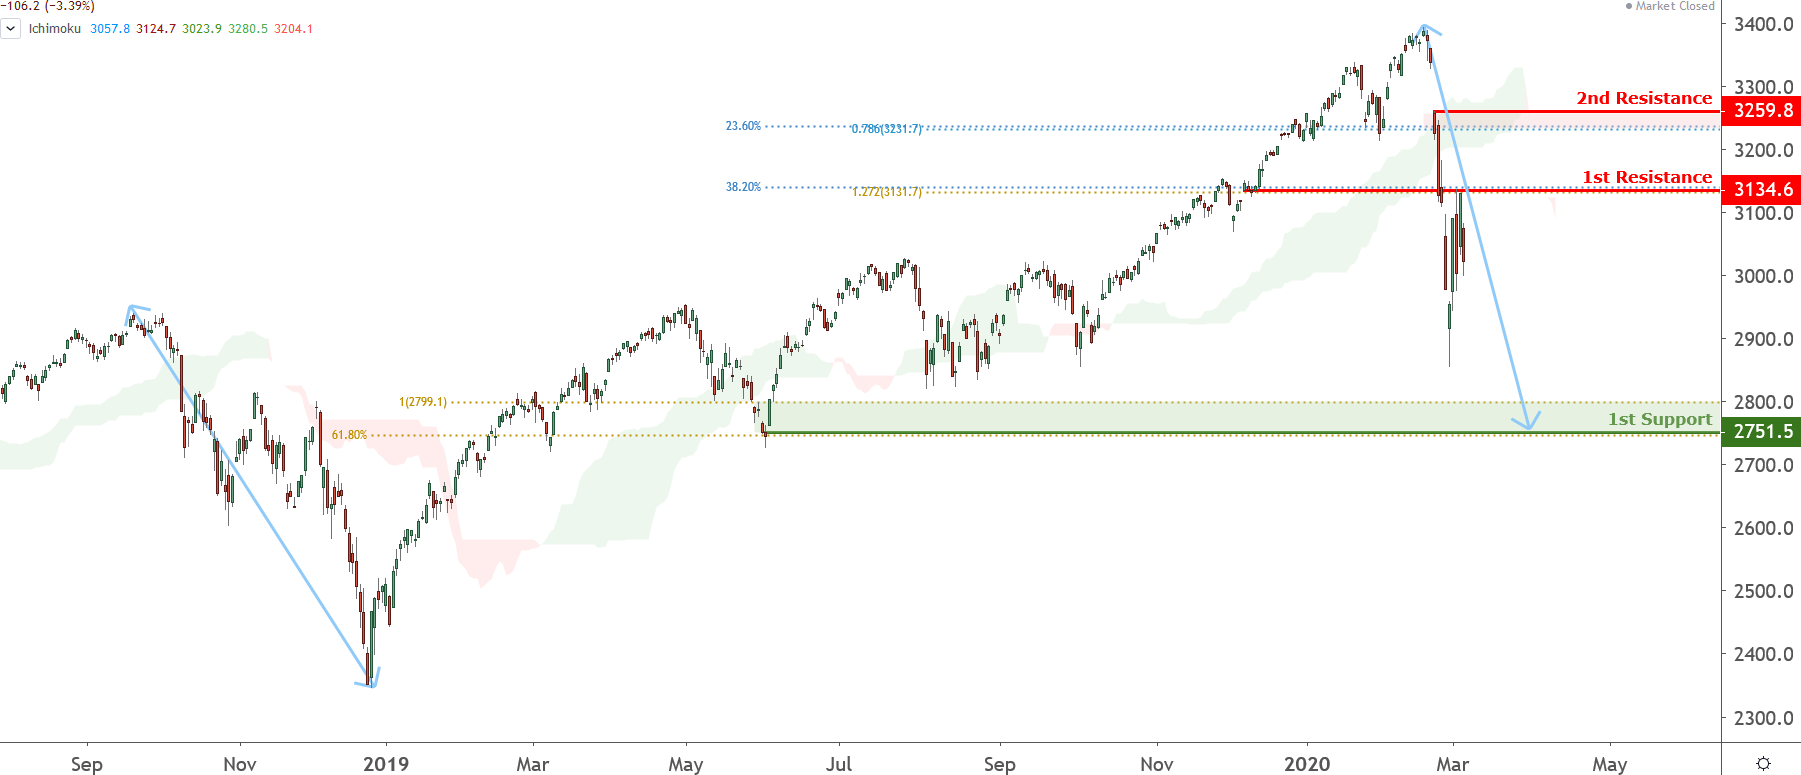
SPX Chart
CURRENCY: XAUUSD
XAU/USD Chart
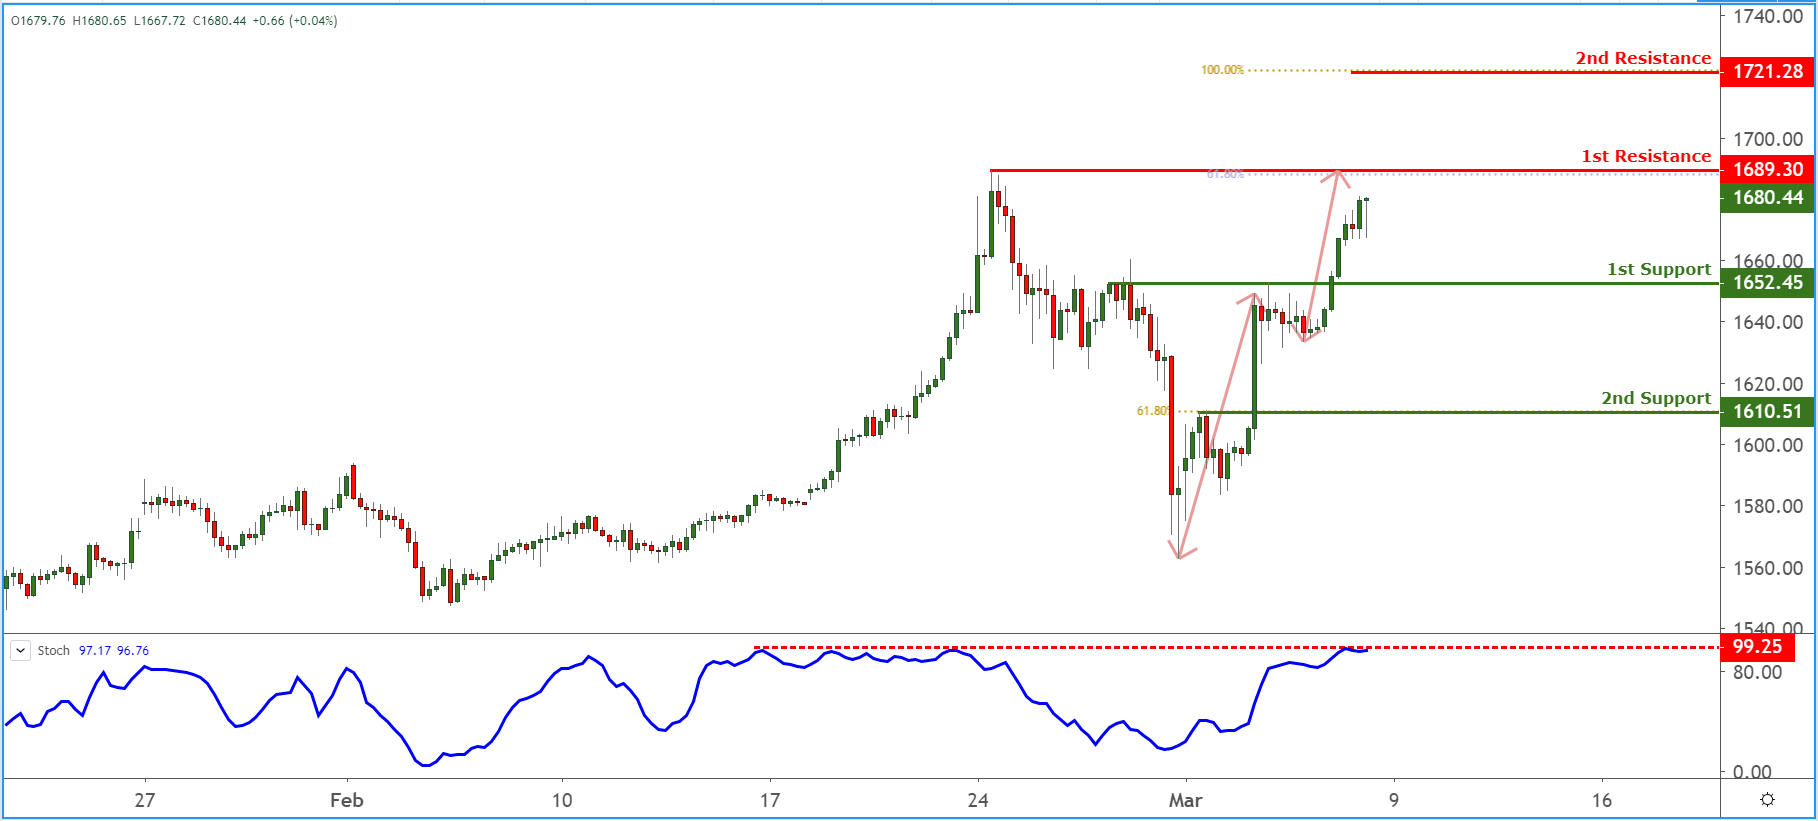
Gold pushed higher on growing fears surrounding the Covid19 global epidemic. Price currently coming close to recent swing high at 1st resistance 1689.30, below which a short term pull back towards support at 1652.45 could be expected. Stochastics testing resistance as well. If the bullish momentum is too strong, we could possibly see price break above the graphical swing high and make for a push towards 2nd resistance.
CURRENCY: WTIUSD (USOIL)
WTI/USD Chart
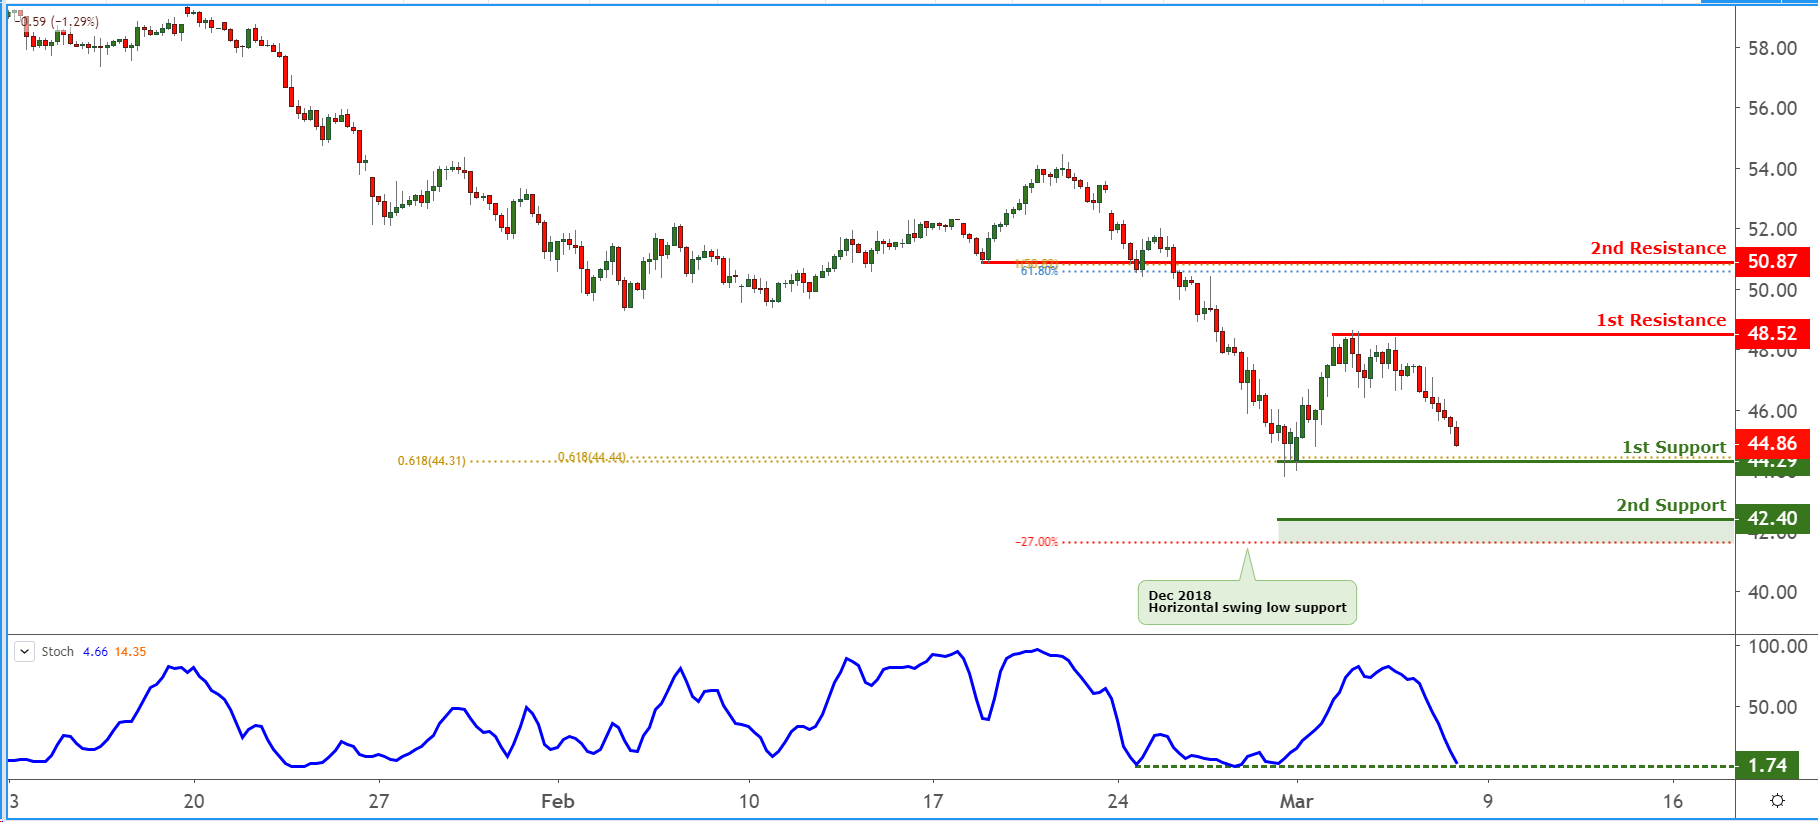
WTI drifted lower over the course of the week. Now, price is coming close to support at the 44.29 price level. A short term relief bounce above this level towards resistance at 48.52 could be a possibility. Technical indicator stochastics is currently testing support level as well. Breaking below 1st support should see the price of WTI drop towards 2nd support at 42.40 which is also December 2018’s low.


