
USDCHF trades lower for the second consecutive trading session amid broad
greenback weakness. USD is under selling pressure after yesterday the U.S. Initial Jobless Claims registered in at 2123K above the expectations of 2100K in May. The four-week moving average was 2,608,000, a decrease of 436,000 from the previous week’s average. The U.S. Gross Domestic Product Annualized came in at -5%, below the forecasts of -4.8% in the first quarter, the fourth quarter of 2019 was at 2.1%. The Durable Goods Orders dropped to -17.2% but beat the forecasts of -19% in April.
In Switzerland, the May KOF leading indicator index came down to 53.2 well below the expectations of 70.0.
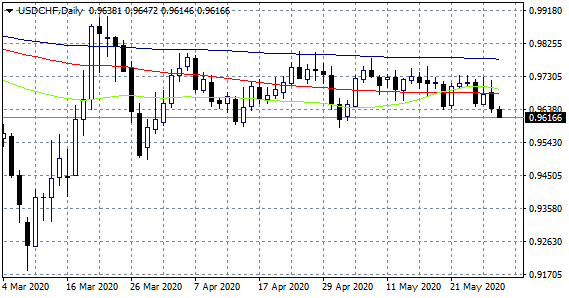
The technical outlook for USDCHF is bearish for the pair as now is trading below the major daily moving averages. On the downside, the first support for USDCHF stands at 0.9621, the daily low. The next level to watch for USDCHF on the downside is the low from May 1 at 0.9585. A break below will provide a bearish signal. The next support area is at 0.9499, the low from March 10.
On the other hand, the first support for the USDCHF pair will be met at 0.9645, the daily high. A break above 0.9645 might open the way for a test of the critical resistance at the 100-day moving average (0.9684). If the USDCHF breaks that resistance, then bulls will be in control, targeting 0.9696 the 50-day moving average.