
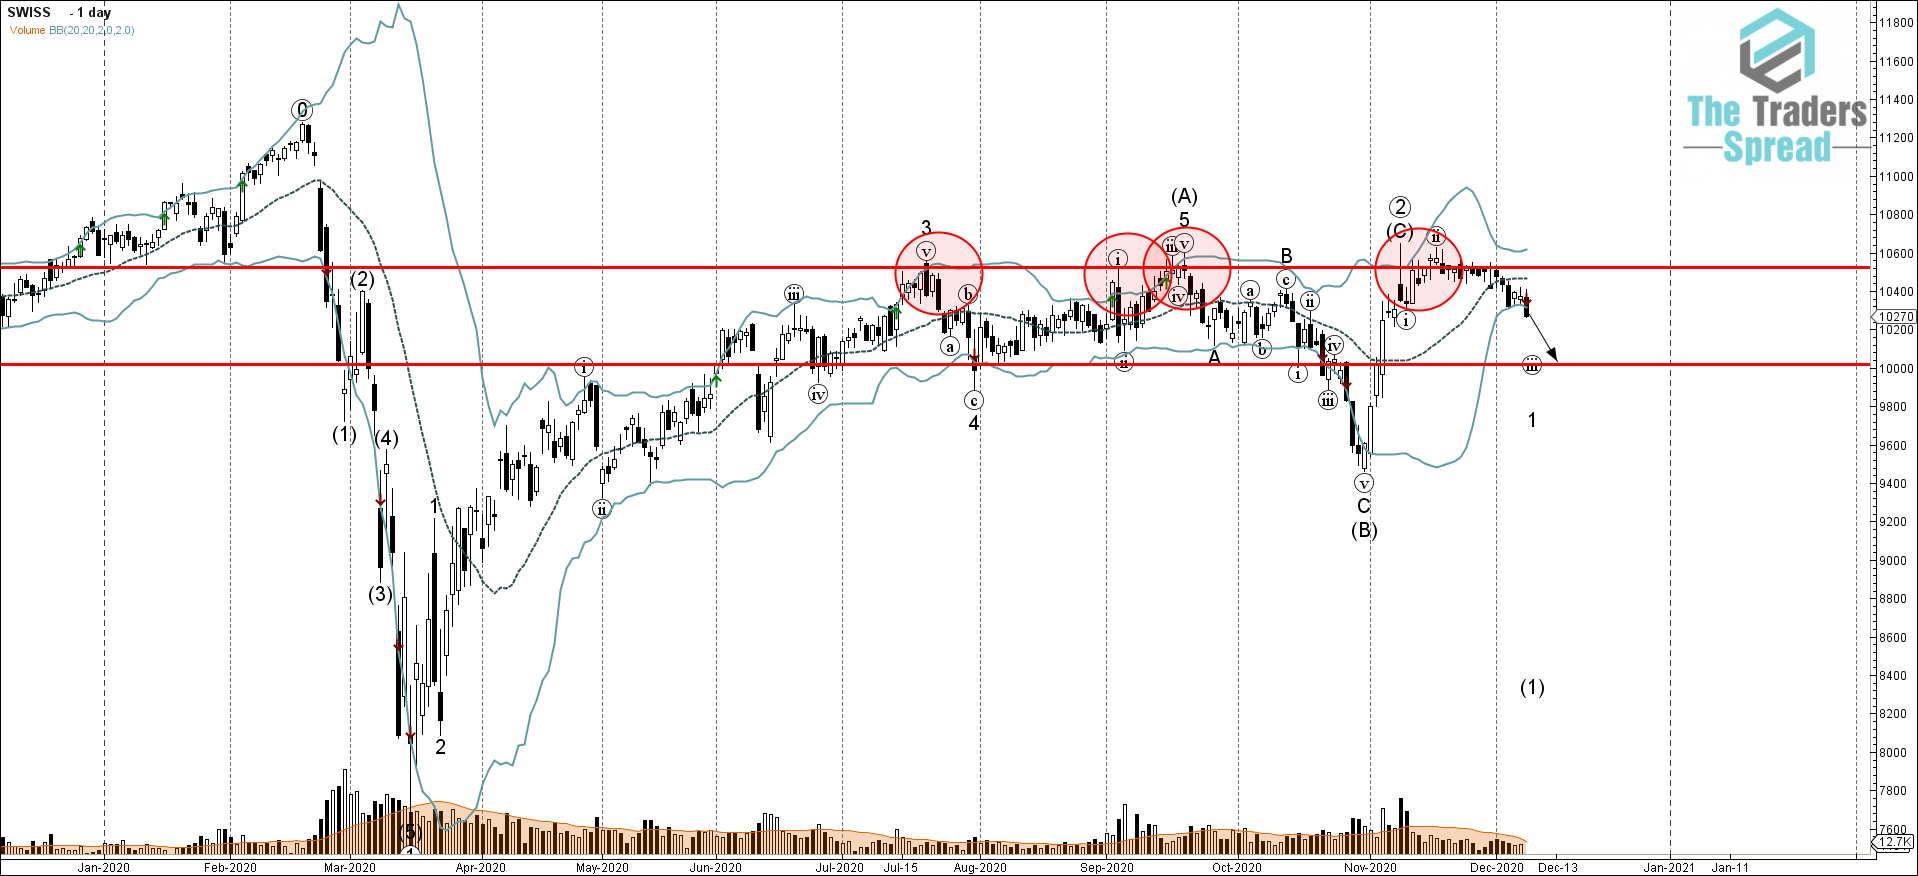
- Swiss20 reversed from multi-month resistance level 10500.00
- Likely to fall to 2236.00
Swiss20 index continues to fall inside the sharp downward impulse wave (i) which belongs to the impulse wave 1 which started recently when the index reversed down from the powerful multi-month resistance level 10500.00 (which has been steadily repeatedly the price from the middle of July as can be seen from the daily Swiss20 chart below) – standing near the upper weekly and daily Bollinger Bands.
Given the strength of the strength of the aforementioned resistance level 10500.00 – Swiss20 is expected to fall further toward the next round support level 10000.00 (which is the calculated price for the completion of the active sub-impulse wave (iii)).
Was this post helpful?
Let us know if you liked the post. That’s the only way we can improve.


