- Sugar reversed from support level 14.30
- Likely to rise to 14.90
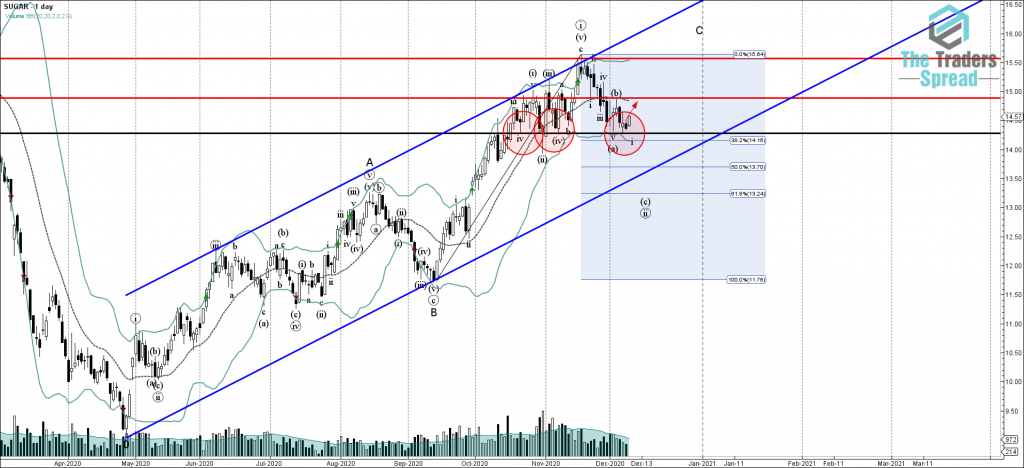
Sugar earlier reversed up with Japanese candlestick reversal pattern Doji from the pivotal support level 14.30 (which has been reversing the price from the middle of October as can be seen from the daily Sugar chart below), intersecting with the lower daily Bollinger Band and the 38.2% Fibonacci correction of the previous sharp upward impulse from the middle of September. The upward reversal from the support level 14.30 continues the active medium-term impulse wave (C).
Given the proximity of the support level 14.30 and the clear multi-month uptrend that can be seen on the daily Sugar charts – Sugar can be expected to rise further toward the next resistance level 14.90 (top of the previous short-term correction (b) from the start of December).

