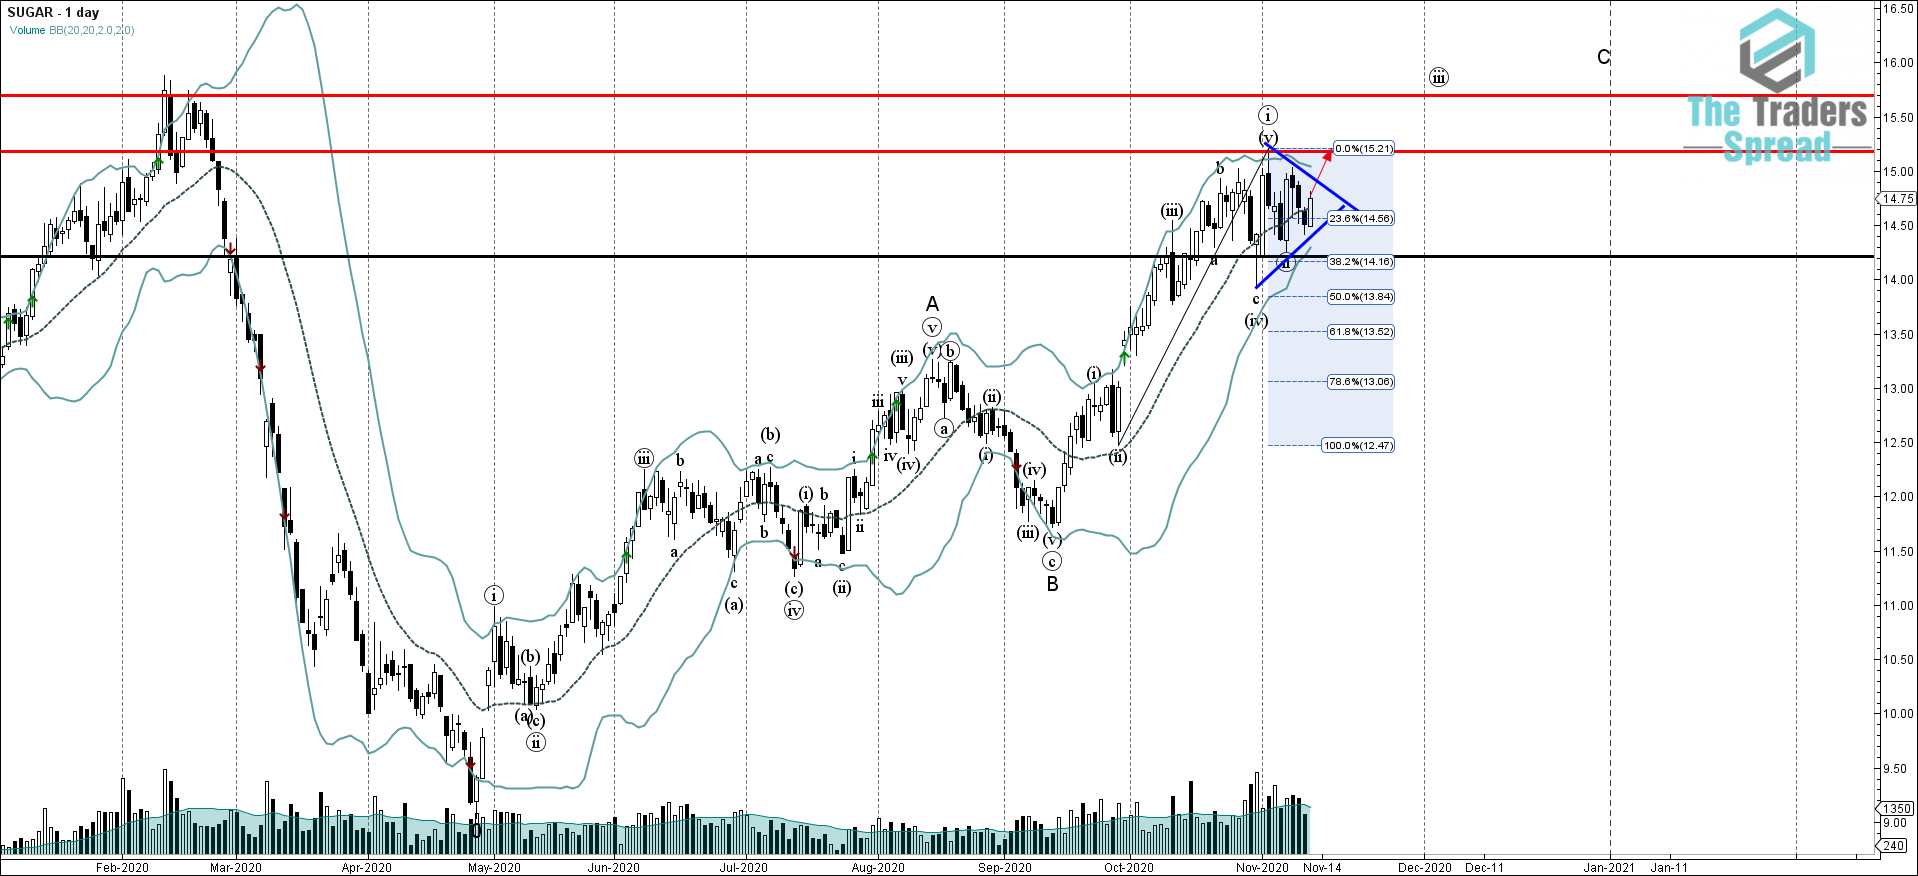
- Sugar rising inside daily Triangle
- Likely to test the resistance level 15.20
Sugar continues to rise inside the minor daily Triangle chart pattern – which has been forming in the last few trading sessions after the earlier upward reversal with the daily Hammer from the key support level 14.21 (standing near the lower daily Bollinger Band and the 50% Fibonacci correction level of the previous sharp upward impulse wave from the end of September). The latest upward reversal from this support zone created the second connecting point for the lower trendline of this Triangle.
Given the clear multi-month uptrend from April – Sugar is expected to break this Triangle and to rise further in the active impulse waves (iii) and C toward the next strong resistance level 15.20 (which formed the top of this Triangle at the start of November).