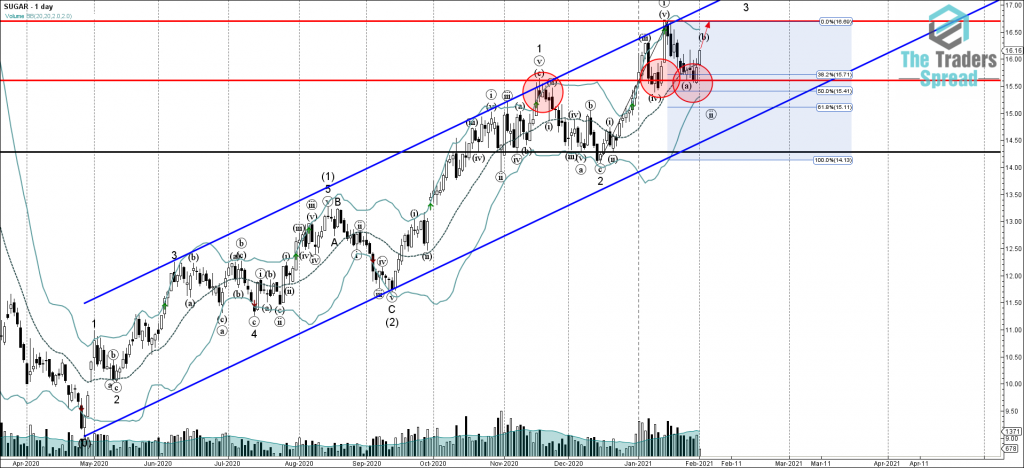
• Sugar reversed from support level 15.60
• Likely to reach resistance level 16.70
Sugar recently reversed up from the support area located between the key support level 15.60 (former monthly high from November – which stopped the previous sharp upward impulse wave 1), lower Bollinger Band and the 38.2% Fibonacci correction of the previous upward impulse form the middle of December. The upward reversal from this support area started the active short-term corrective wave (b).
Given the strength of the active daily uptrend – Sugar is expected to rise further toward the next resistance level 16.70 (top of the previous sharp impulse wave (i) from last month) – from where the price is likely to correct down on the overbought daily Stochastic.

