• Sugar reversed from support area
• Likely to rise resistance level 20.35
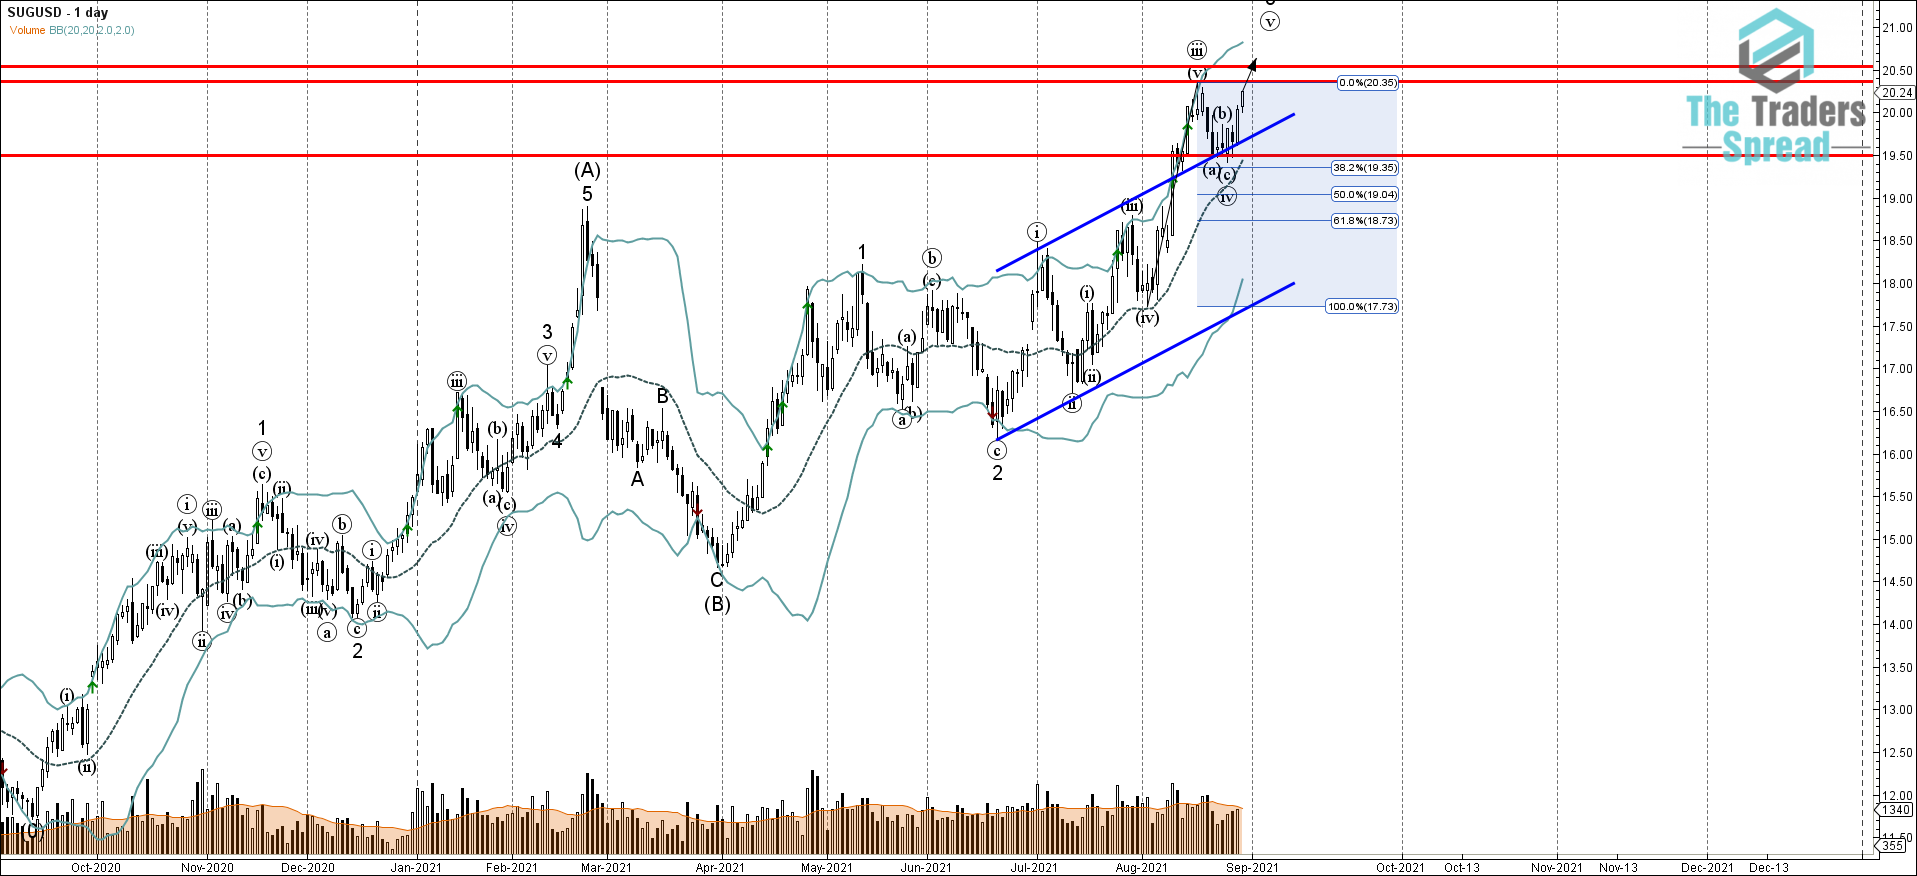
Sugar continues to rise after the price reversed up from the support area located between the key support level 19.50, 38.2% Fibonacci correction of the upward price impulse from July and the upper trendline of the daily up channel from June (acting as the support after it was broken earlier). The upward reversal from this support area started the active impulse wave (v).
Given the clear multi-month uptrend that can be seen on the daily charts – Sugar can be expected to rise further toward the next resistance level 20.35 (top of the pervious impulse wave (iii) from the middle of August) – followed by the resistance level 20.50.
Was this post helpful?
Let us know if you liked the post. That’s the only way we can improve.


