
- S&P 500 reversed from support area
- Likely to rise to 3340.00
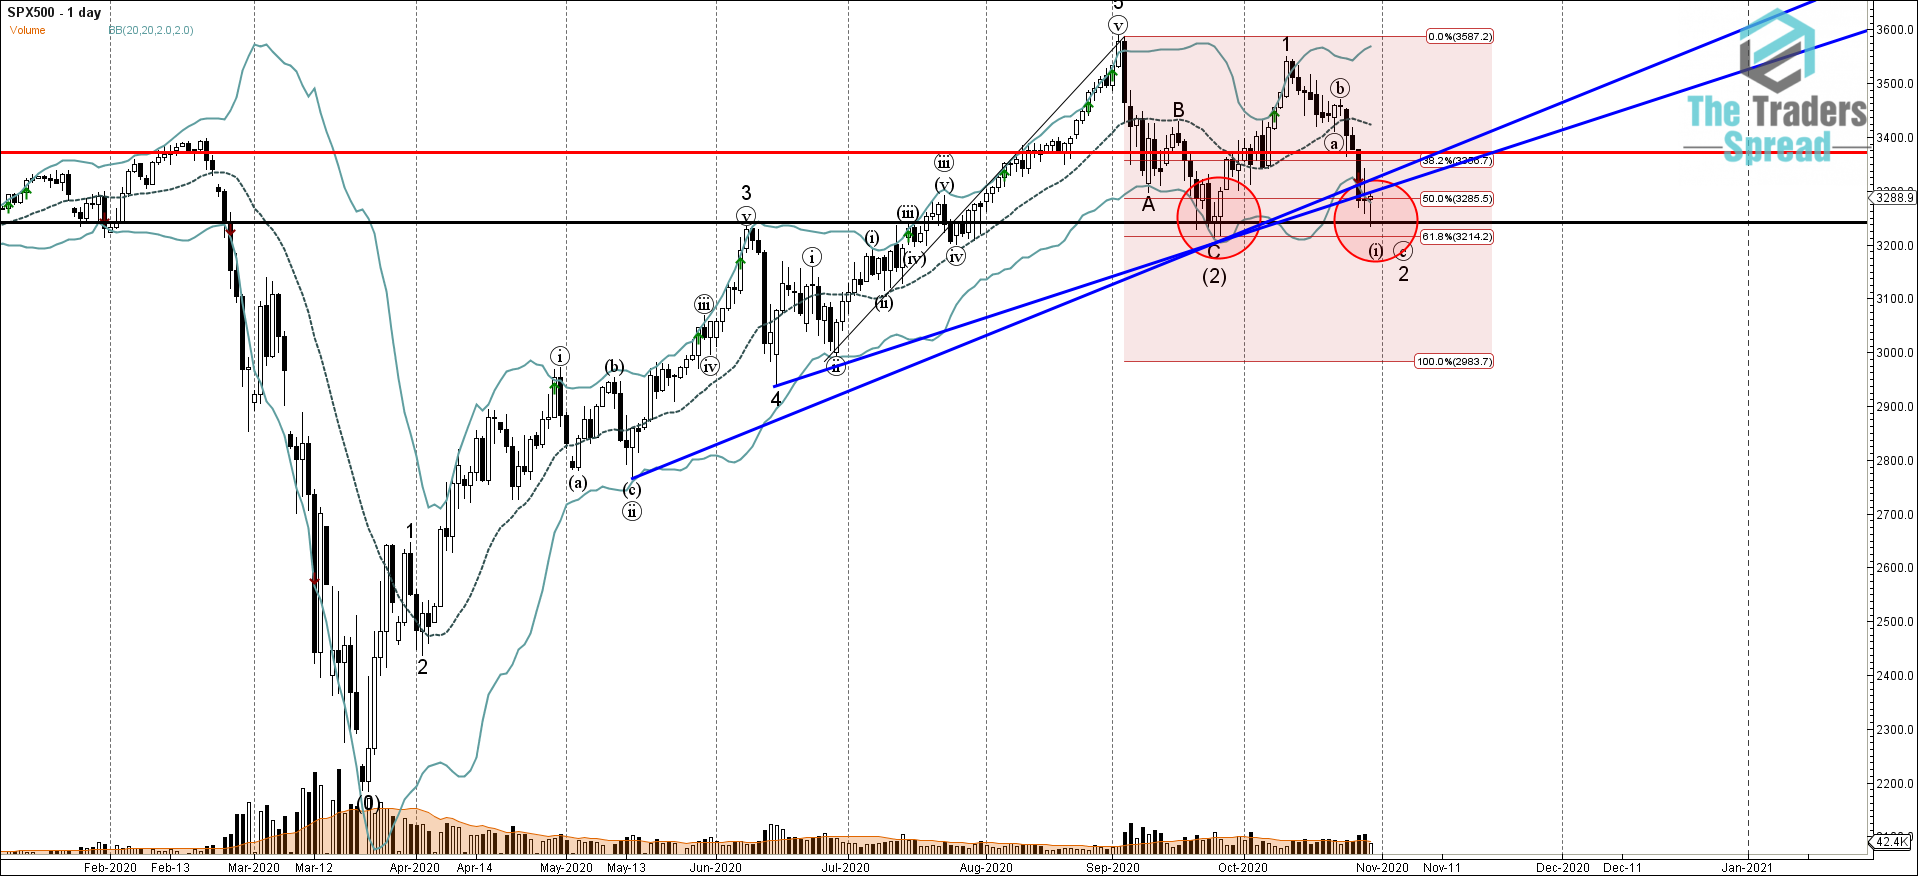
S&P 500 Index forming the daily Japanese candlesticks reversal pattern Hammer on pre-open – following the earlier yesterday’s daily Doji candlesticks reversal pattern near the support zone located at the intersection of the two different-length upward sloping support trendlines form June and May, support level 3240.00 (former powerful resistance from July), lower daily Bollinger Band and the 50% Fibonacci correction of the preceding upward impulse from June.
Considering the multi-month uptrend – S&P 500 is expected to continue the upward movement toward the next resistance level 3340.00 (top of the previous daily Doji, intersecting with the aforementioned trendlines – acting as resistance trendlines after they were broken).
Was this post helpful?
Let us know if you liked the post. That’s the only way we can improve.


