
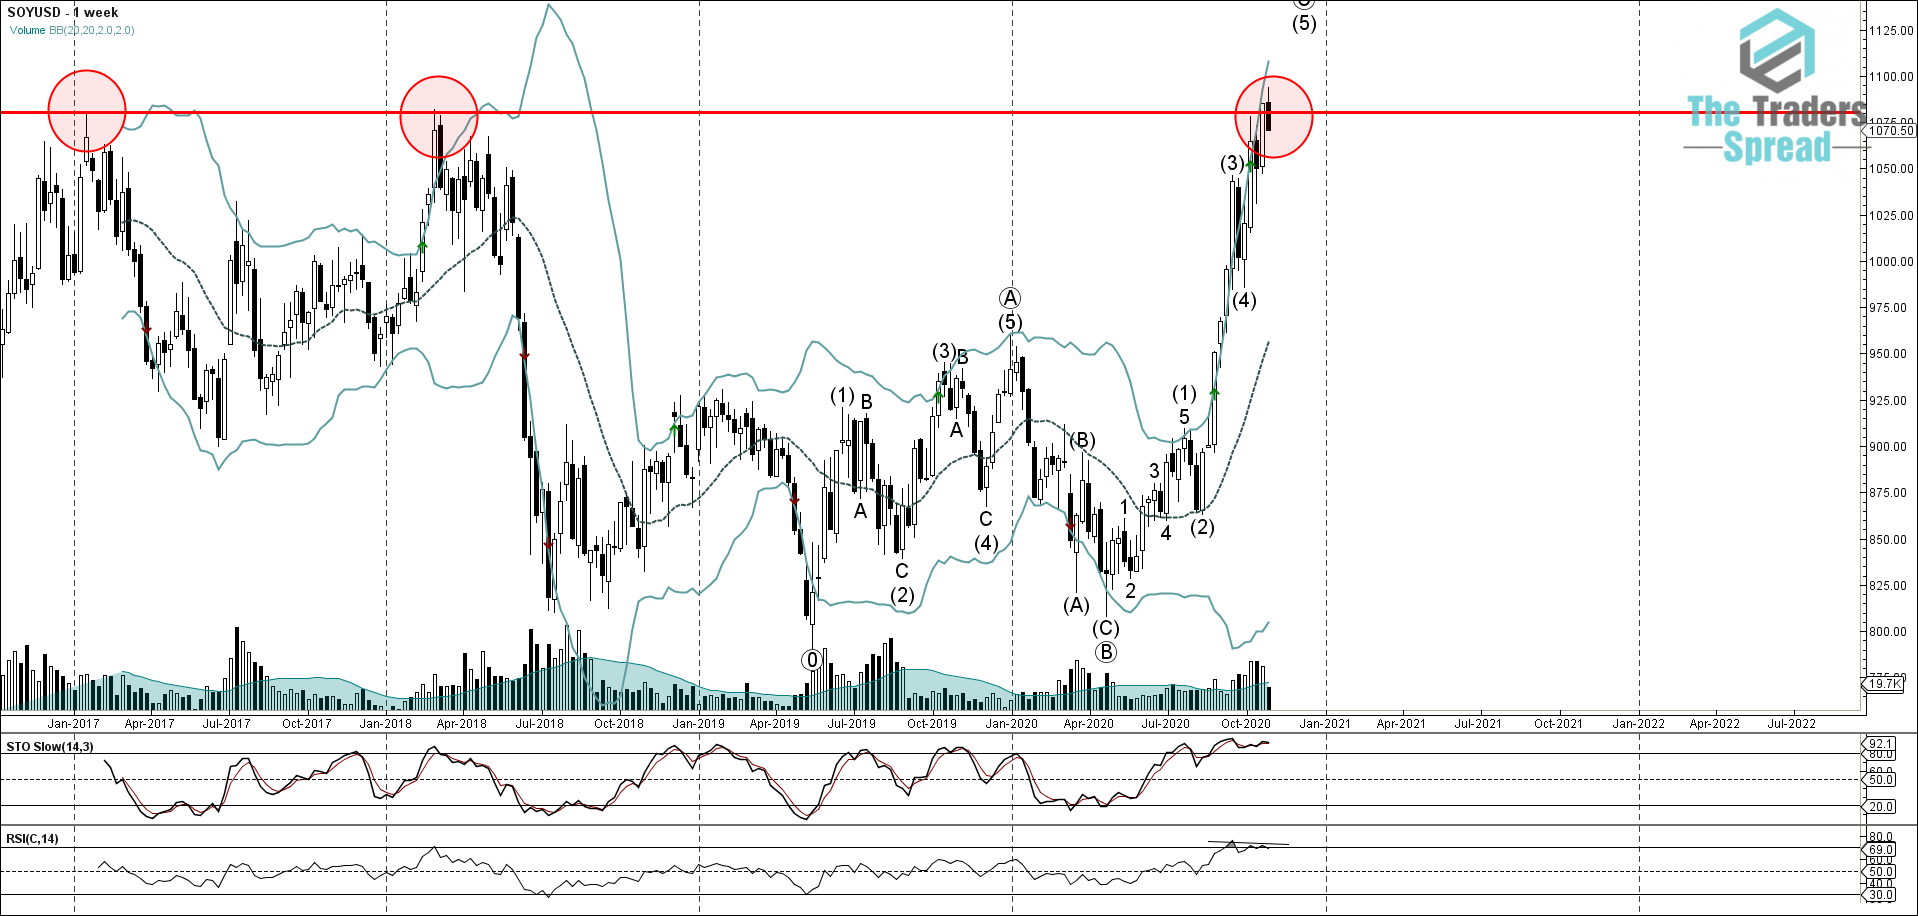
- Soybeans reversed from resistance level 1080.00
- Likely to correct to 1050.00
Soybeans falling strongly today – which follows the earlier sharp downward reversal from the long-term resistance level 1080.00 (which has been steadily reversing the price from the start of 2017, as can be seen from the weekly Soybeans chart below), intersecting with the weekly and the daily upper Bollinger Bands – which further strengthened this resistance level. The downward reversal from 1080.00 created the daily Japanese candlesticks reversal pattern Shooting Star.
With the weekly Stochastic showing overbought reading and the weekly RSI recently forming bearish divergence Soybeans is expected to remain heavily sold in the coming trading sessions – with the next support at 1050.00 seen as the likely target for this decline.
Was this post helpful?
Let us know if you liked the post. That’s the only way we can improve.


