• Soy under bearish pressure
• Likely to test support level 1380.00
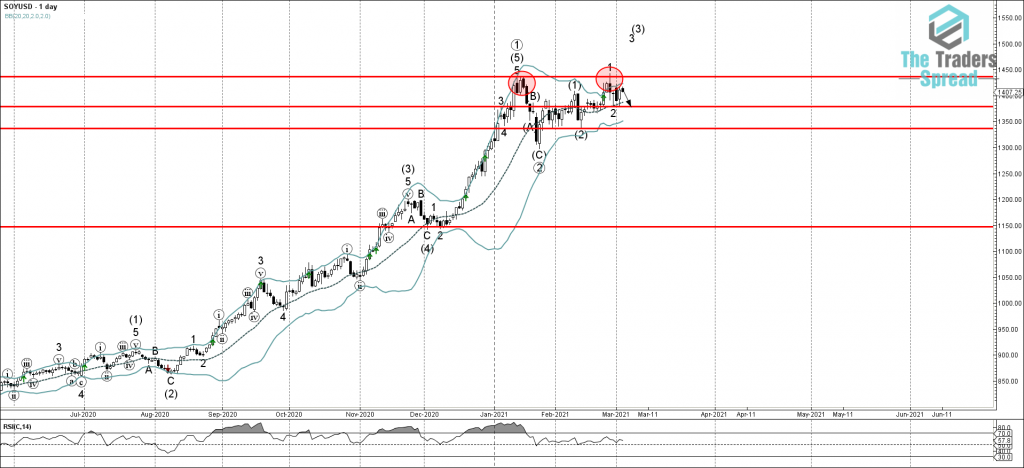
Soy under bearish pressure after the price reversed down with the daily Japanese candlesticks reversal pattern Bearish Engulfing chart pattern from the strong combined resistance area lying between the key resistance level 1436.00 (which stopped the previous sharp upward impulse wave (5) at the start of January) and the upper daily Bollinger Band. The downward reversal from this resistance stopped the previous minor impulse wave 1.
Given the strength of the aforementioned resistance area and moderate risk off sentiment seen across the commodity markets seen today – Soy is likely to fall further toward the next support level 1380.00 (which has been steadily reversing the price from the middle of February).