
• Soy reversed up from the support area
• Likely to rise to resistance level 1261.15
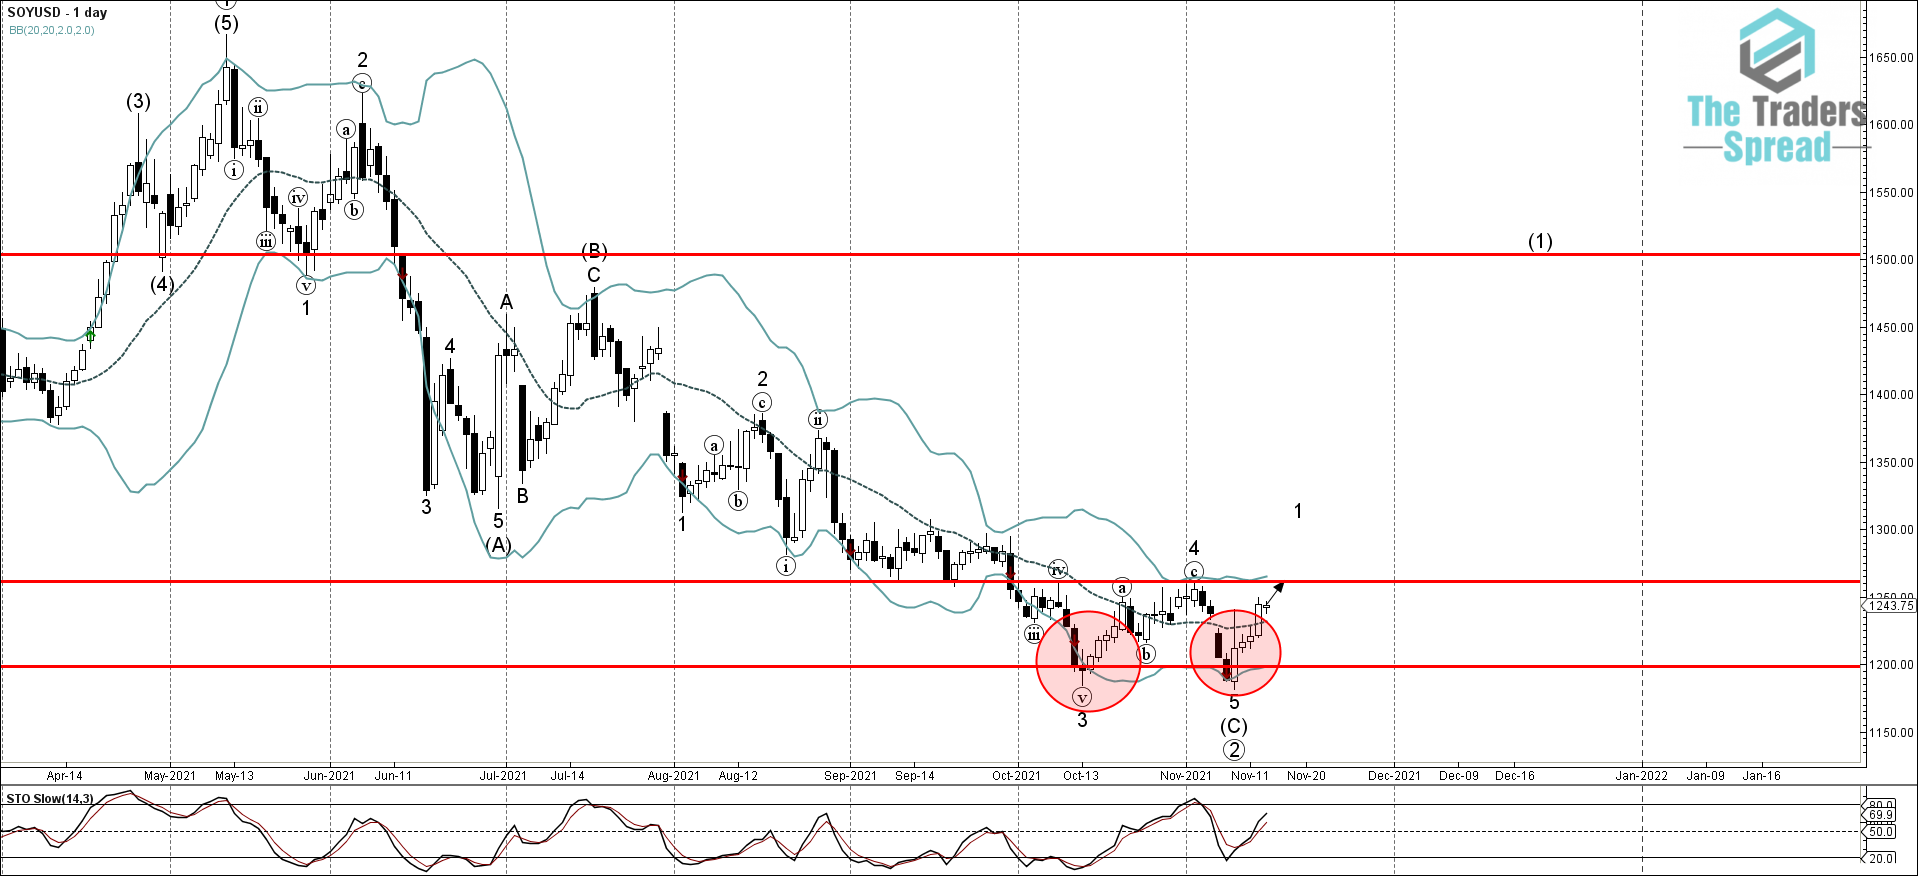
Soy recently reversed up from the support area located between the major support level 1200.00 (which stopped the previous downtrend in the middle of October, as can be seen from the daily Soy chart below) and the lower daily Bollinger band. The upward reversal from this support zone stopped the previous extended intermediate impulse wave (C) from the end of July.
Given the strength of the aforementioned support area and the clear bullish divergence on the daily Stochastic indicator seen today, Soy can be expected to rise further toward the next resistance level 1261.15 (which has been reversing the price from the start of September).
Was this post helpful?
Let us know if you liked the post. That’s the only way we can improve.


